Download
1 / 26
260 likes | 388 Views
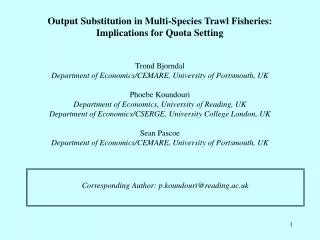
Output Substitution in Multi-Species Trawl Fisheries: Implications for Quota Setting Trond Bjorndal Department of Economics/CEMARE, University of Portsmouth, UK Phoebe Koundouri Department of Economics, University of Reading, UK Department of Economics/CSERGE, University College London, UK

E N D
Output Substitution in Multi-Species Trawl Fisheries: Implications for Quota Setting Trond Bjorndal Department of Economics/CEMARE, University of Portsmouth, UK Phoebe Koundouri Department of Economics, University of Reading, UK Department of Economics/CSERGE, University College London, UK Sean Pascoe Department of Economics/CEMARE, University of Portsmouth, UK Corresponding Author: p.koundouri@reading.ac.uk
Motivation • Interactions between species in a fishery may be: • - Biological (e.g. predator-prey). • - Technical (e.g. joint production). • - Total allowable catches (TACs) are set on biological (species by species) basis. • Implicit assumption: fishers are able to adjust their product mix in line with TAC. • Aims of the paper: • Quantify technical interactions within fisheries: estimation of multi-output distance function. - Calculate elasticities of substitution between the outputs. • Implications for the potential for fishers to alter their targeting behavior. • Implication for quota setting. • Empirical Results from application on the UK North Sea beam and otter trawl fisheries: • - The potential of substitutability between the main species is relatively small. • Setting TACs on an individual species’ basis is inappropriate in multi-species fisheries. • - Implications for fisheries management in several countries:Failure to quantify and integrate these technical interactions in the construction of management instruments for fisheries regulation, may result in increased discarding, illegal fishing and potentially lower than expected future yields.
Presentation Outline • Literature Review: previous studies involving the estimation production functions in fisheries and the treatment of multiple outputs. • Description of Methodology and Theoretical Model. • Econometric Specification of Theoretical Model. • Description of the fishery examined and the data used in the analysis. • Empirical results, including estimates of the elasticities of output substitution. • Policy implications.
Literature Review (1/4) • The Issue: Jointness in Production in Multi-Species Fisheries • Difficult to target individual species (output is characterized by joint production). • Firms exploit several fish stocks (by-catch). • - Catch composition is a function of the type of gear employed and the relative abundance of the different species in the different areas or times fished. • The challenge is to correctly model this situation in order to derive reliable policy recommendations with regards to the efficiency implications of the existing regulatory regime. • Single vs multi-output production functions in fisheries: • Single-output production functions(at individual boat level / aggregate fishery level): e.g. Hannesson(1983), Bjørndal(1989), Campbell & Lindner(1990), Squires(1987), Pascoe & Robinson(1998) Objective: estimate input-specific output elasticities & the potential for input substitution. Recently, emphasis has shifted to the estimation of production frontiers: • 1. Interest in technical efficiency. • 2. Theoretical and empirical reasons (estimation of production frontiers has advantages over the estimation of production functions; Kumbhakar (2002)).
Literature Review (2/4) • Single-Output Production Frontiers (Technical Efficiency Estimations): e.g. Salvanes & Steen (1994), Kirkley et al. (1995, 1998), Campbell & Hand (1998), Squires & Kirkley (1999), Grafton et al. (2000), Pascoe et al. (2001), Pascoe & Coglan (2002), Alvarez & Orea (2001), Herrero and Pascoe (2003). Findings: • Restrictions on input use may lead to input substitution, resulting in a sub-optimal combination of inputs (technical & allocative) relative to the unrestricted situation. • - Measures to reduce the ability of fisheries to harvest the resource without reducing the total level of employment, may result in contraction or shifts in the production frontier through technological changes. • - Management may result in improved input allocative efficiency through removing incentives to overcapitalise. • - When changes in quota allocations do not reflect changes in stock conditions, actual catch may diverge from planned catch, and output may be less than efficient given the level of inputs.
Literature Review (3/4) Reliance on a single measure of output can be problematic! • Adding up the weight of each outputassumes all species are equally important in the catch (not the case in fisheries as high volume species tend to be low value). • Using total revenue as the output measure requires the assumption that output prices do not differ between firms & changes in output due to changes in price need to be compensated. • Weighting the quantity of each output on the basis of its revenue share, assumes revenue maximising behaviour and competitive output markets. • Aggregate production function imposes separability in inputs & output on the transformation function. (I.e. input mix can be changed significantly without affecting the slope of the production possibility curve; marginal costs depend only on the output mix, hence are independent of the input prices).
Multi-Output Measures Data Envelopment Analysis (DEA) (e.g Squires and Kirkley(1999), Pascoe et al. (2001))Use of linear programming methods to construct a non-parametric piecewise frontier over the data.- Non-parametric, hence sensitive to random error.- Does not provide estimates of the impact of individual inputs on the level of outputs.- Does not provide estimates of the relationship between the outputs themselves. The Multi-Output Production Function (e.g. Alvarez and Orea, 2001)Regress one (of two) outputs against the other output and a set of inputs. - Output selected as dependent variable plays an asymmetric role, which affects the estimated parameters of the production technology. The Output-Distance Function (e.g. Shephard (1970), Fare & Grosskopf (1990), Grosskopf et al. (1995), Coelli & Perelman (1996) and Morrison et al. (2000)).Normalized and restricted model that considers the maximal proportional expansion of the output vector given an input vector. - Every output plays the same role, avoiding the asymmetry problem (i.e. the efficiency measures are not output specific but radial).- Estimation is possible without separability and jointeness.- Information on prices is not required.- Assumes linear homogeneity in outputs, i.e. both efficiency & noise are radial. Literature Review (4/4)
The Multi-Output Distance Function (1/ 2) y2 y2a = 0A/0B • y : output vector • x : input vector • : level of efficiency • P(x): output set, P(x) = {y : x can produce y} • (i) D0(x, y) is non-decreasing in y and increasing in x • (ii) D0(x, y) is linearly homogeneous in y • (iii) D0(x, y) = 1 if y belongs to the “frontier” of the production possibility set • (efficient firm: D0(x, y) = =1; inefficient firm: D0(x, y) = <1) B C A P(x) PPC 0 y1a y1
The Multi-Output Distance Function: The Properties of the Production Set (2/2 ) For each x, P(x) has the following properties: (i) 0 є P(x) (ii) Non-zero output levels cannot be produced from zero level of inputs (iii) P(x) satisfies strong disposability of outputs: if yє P(x) and y* = y then y*є P(x) (iv) P(x) satisfies strong disposability of inputs: if y can be produced from x, then y can be produced from any x*= x (v) P(x) is bounded (i.e. we cannot produce unlimited levels of outputs with a given set of inputs) (vi) P(x) is convex (i.e. if two combinations of output levels can be produced with a given input vector x, then any average of these output vectors can also be produced; this requires commodities to be continuously divisible).
Theoretical Model: Restricted Multi-Output Distance Function (1/ 2) • - In Individual Vessel Quota (IVQ) regulated fisheries, harvest is an exogenous/restricted factor. • The price-taking fishermen max. profits for a given level of harvest (quota is the fixed factor) • The restricted profit maximization problem: ПRit(.): vessel & time specific restricted profit function Cit(.) :vessel & time specific restricted cost function Yit: vessel & time-specific aggregate harvest quantity (output vector) Hit:harvest level, restricted by quotas Outputs & respective competitive market prices: Plaice:yPi ,pP ;Sole: yS , pS ;Cod:yC , pC ;Angler: yAit , pAt ;Other: yOit ,pOt . Inputs & respective price vectors: xEit : days employed in fishing (capital utilization), pEt xKit :capital , pKt
Theoretical Model: Restricted Multi-Output Distance Function (2/2 ) • DRis defined on the output set, P(Xit;Hit) = {Yit: Xit can produce Yit given Hit} • Non-decreasing in outputs & increasing in inputs • Linearly homogeneous in outputs • DR (.) =1 if Yi belongs to the frontier • - θit : proportional (radial) expansion of output vector that brings the ith firm to efficient frontier • Shepard (1970): Do function may be obtained as a profit maximal profit function:
Econometric Specification of the Theoretical Model (1/2) • The translog distance function with M (m = 1, 2, … , M) outputs and K (k = 1, 2, … , K) inputs, and for I (i = 1, 2, … , I) firms, can be given by: • Symmetry restrictions: • Homogeneity Restrictions: Homogeneity restrictions can be imposed through normalising by one of the outputs:
Econometric Specification of the Theoretical Model (2/2) • Function to be estimated: • vi: error term (assumed N[0, ] ) • ui: one-sided inefficiency term, which can take one of several distribution forms; e.g. • exp(-ui): level of efficiency (hence lnDi = -ui) • inefficiency has a time-invariant component, (T: terminal time period).
Elasticities of substitution (1/1) • Elasticities of substitution can be directly derived from the distance function: • Ayy´ : Allen elasticity of substitution between output y and y´ • ve Ayy ´ : outputs are substitutes • +ve Ayy ´ : outputs are complementary • Size Ayy ´ : a measure of the strength of the substitute/complementarity relationship Notes: - To estimate 1st and 2nd order derivatives, a and b relating to the output over which the production function was normalized need to be derived. - This can be done by using the homogeneity restrictions that were imposed on the model.
The UK North Sea Demersal fishery (1/3) • The North Sea contains a number of interacting multi-species fisheries of great importance • to many countries (UK, Denmark, the Netherlands, France, Germany, Belgium and Norway). • Over half of the combined total allowable catches (TAC) of all species in all EU waters are taken from the North Sea. • Based on TACs and the guide prices for each species, the total value of the allowable catch in 1999 was 1.5 billion Euro (guide prices are generally lower than market prices). North Atlantic Fishing Grounds. North Sea: Division IV.
The UK North Sea Demersal fishery (2/3) • We focus on two main fleet segments that make up the majority of the UK NS DF: - The UK beam trawl fleet: - targets high value flatfish (sole & plaice) - also catches considerable quantities of cod and anglerfish - also catches small quantities of other species as bycatch • Most of the stocks are heavily over-fished, resulting in a substantial • decrease in quota levels over recent years (1994-2000). • The fishery has been targeted for decommissioning as it is • considered to have considerable excess capacity. • - The English otter trawlers fleet: - target cod, haddock, saithe and whiting - also catch plaice and nethrops - also catches a range of other species is caught as bycatch • The key species caught by both groups are subject to quota controls under the European Common Fisheries Policy. • The catches in each time period were normalized using the stock indexes (allows the effects of changes in stock size on catch to be incorporated into the analysis, but imposes the implicit assumption of unitary output elasticity with respect to stock size). Fleet size has been almost halved between 1994-2000
The UK North Sea Demersal fishery: Data (3/3) Relative stock indexes (based on total available biomass; 1990 base period) Data Source: International Council for Exploitation of the Seas (ICES) Beam Trawl Species Otter Trawl Species
L(H0) L(H1) c2 Probability Beam trawl g = 0 -163.578 -100.621 125.915 <0.01%a bi,j = 0 -275.485 -100.621 349.728 0.00% m = 0 -102.542 -100.621 3.841 5.00% h = 0 -108.800 -100.621 16.359 0.01% Otter trawl g = 0 -687.097 -481.432 411.331 <0.01% a bi,j = 0 -810.856 -481.432 658.848 0.00% m = 0 -490.692 -481.432 18.521 0.00% h = 0 -495.743 -481.432 28.622 0.00% Specification Tests (1/1) • The results of the specification tests indicate that the translog is the most appropriate functional form, that inefficiency exists, and that the most appropriate distributional assumption for the inefficiency is a truncated normal distribution with time varying inefficiency. a. Based on the one sided distribution tables developed by Kodde and Palm (1986). - Generalized likelihood ratio statistic: - The restrictions form the basis of the null hypothesis. - The value of l has ac2 distribution; degrees of freedom given by the number of restrictions.
Empirical Results (1/5) • Most of the coefficients were found to be significant at the 1 % level. • coefficients: (indicative of the elasticity of the output of the species chosen as the dependent variable with respect to the output of the other species and the inputs): Exception: Haddock (otter trawl) • -ve signs for the outputs of the other species signs substitution • +ve signs for inputs. • output elasticity with respect to days fished 1 (constant returns to days) • output elasticity with respect to engine power < 1 (diminishing returns to boat size).
Empirical Results: Elasticities of Substitution (2/5) • - Small potential for substitutability between the main & alternative species. • sole & plaice (main species for beam trawlers) are substitutes, but ES is small. • cod & haddock (main species for otter trawlers) are substitutes, but ES is small. - Substitution largely limited to bundles of species.
Empirical Results: Relationship between Boat Size & Ability to Target Individual Species (3/5) • More obvious in the beam trawl fleet: larger boats demonstrated a clear substitution relationship between sole & plaice, while the smaller vessels in many cases had a complementary relationship. • Larger boats, more mobile able to change fishing grounds and take advantage of different relative abundance of the species. • Smaller boats, more restricted in their movement, tending to fish in a more limited number of fishing grounds less able to adjust their output mix.
Empirical Results: Distribution of average individual vessel efficiency over the period 1990-2000 (4/5) • Estimated distributions of efficiency for the two fleet segments differ substantially. • - Over 2/3 of beam trawlers were more than 70% efficient on average. • - Over 90% of otter trawlers were less than 70% efficient on average.
Empirical Results: Average Vessel Efficiency, 1990-2000 (5/5) • Average individual otter trawl efficiency increased by around 2.3 % per year. • The removal and replacement of less efficient otter trawlers over the time period resulted in a slight additional increase in average efficiency for the fleet segment as a whole. • Average individual beam trawler efficiency decreased by 6.5% per year. • The removal of the lesser efficient vessels (and introduction of more efficient vessels into the panel) resulted in an overall average decline in the efficiency of the fleet segment.
Policy Implications (1/2) • Otter Trawl Fleet • Decline in the North Sea cod stock substantial declines in allowable catches (to avoid stock collapse and allow the stock to recover). • North Sea TACs of both haddock & saithe were increased by 62% & 55%, respectively (2001-2002). • However, stocks of haddock & saithe are low (ICES), and TAC increases are, in part, a means of ‘softening’ the impact of the decreased cod TACs. • Given the limited substitutability between cod and haddock and also saithe, which is complementary to haddock, the disparity in the TACs may lead to increased discarding of over-quota cod, provided it is economically viable to continue fishing for haddock and saithe without the additional revenue derived from cod.[i]
Policy Implications (2/2) Beam Trawl Fleet • Scientific advice for 2002 (North Sea) : 30% reduction in the TAC of plaice and 20% reduction in the TAC of sole. • Recognition was given to the joint nature of the output of the two species. • Final changes in TACs were: less than 5% decrease for plaice & 16% for sole. • Given the limited substitutability between sole and plaice, the incompatible TACs may result in increased discarding of sole. • However, as sole is substantially more valuable on a per unit basis, it may not be economically viable for fishermen to land only plaice and discard sole, resulting in either the TAC for plaice not being filled, or providing incentives to land over-quota catch of sole illegally.
Concluding Remarks • The results of the study reinforce the need for fisheries managers to consider the technical interactions between species when setting the TACs. • These interactions have been recognized by fisheries scientists, and have been generally assumed to exist by fisheries economists. • This paper is the first empirical analysis to quantify these interactions in the context of fisheries management. • Failure to consider these interactions may result in increased discarding in the fishery, illegal fishing and potentially lower than expected future yields.