Download
1 / 39
390 likes | 792 Views
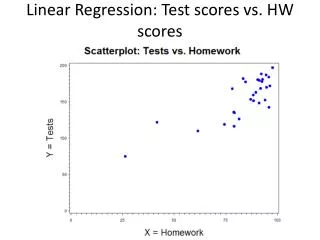
Linear Regression: Test scores vs. HW scores. Linear Regression: Test scores vs. HW scores. Positive/Negative Correlation. Variety of Correlation Values. Example (Tests vs. HW): Correlation. Example: Hypothesis Testing - Correlation.

E N D
Example: Hypothesis Testing - Correlation Is there a correlation between test scores and homework scores within the linear model H0: = 0 : there is no linear correlation between test scores and homework scores HA: 0 : there is a linear correlation between test scores and homework scores This study does provide evidence (P < 0.0001) at the 0.05 significance level that that there is a linear correlation between Homework scores and test scores.
Example: Fitted Regression Line Let X be the total score on the Homework (in points) and Y be the total score on Tests (in points). The following summary statistics were obtained: What is the equation of the fitted regression line?
Example: Fitted Regression Line (cont) Tests = 34.84 + 1.45 Homework R2 = 0.6288
Hypothesis testing Step 1: Does X influence Y within the linear model ? Step 2: Let β1 be the slope of the linear regression of Y on X. Step 3: H0: β1 = 0; there is no linear influence of X on Y. HA: 1 ≠ 0; there is a linear influence of X on Y. Step 9: This study does [not] provide evidence (P = ?) at the significance level that that there is a linear association of X on Y.
Example: Hypothesis Testing Does homework scores influence test scores within the linear model Is there a nonzero linear influence of Homework scores on Test scores? Let β1 be the slope of the linear regression of Tests on Homework.
Example: Hypothesis Testing (cont) H0: β1 = 0 : there is zero linear influence of Homework on tests HA: β1 0 : there is a nonzero linear influence of homework on test This study does provide evidence (P < 0.0001) at the 0.05 significance level that that there is a (positive) linear influence of Homework score on test scores.
Chapter 13 1. What question were the researchers attempting to answer when they collected these data? 2. What is the response variable in the study? 3. What predictor variables, if any, were involved?
Case Studies For each of the 4 research question in the following cases, propose the appropriate statistical methods, what assumptions need to be checked for the method and how to check those assumptions.
Case 1: Consumer opinions on the effectiveness of energy drink The consumer opinions on the effectiveness of energy drink. Background: The popularity of energy drinks has risen constantly since the introduction of the first major energy drink in 1997, Red Bull. An energy drink, by definition, is a drink aimed to increase the consumer’s mental alertness and physical performance. A serving of energy drink can contain the same amount of caffeine as 5 ounces of coffee, which is the same as two cans of popular caffeinated soft drinks. The typical college students’ day consists of strenuous and demanding schedule. One can often strike the need to get an extra boost of energy or alertness during the day in order to accomplish. The point of the study is to indentify if energy drinks are an effective tool for a typical college student, and what factors influence students’ rating of effectiveness. In total there are five variables measured: age, gender, average sleeping hour, stress level and effectiveness.
Case 1 (Cont) Data: A 6-question survey was given to 33 randomly and independently chosen college students. A sample data is shown below. Research question 1: the effectiveness is related with the resting situation. So the time spent on sleeping impacts students’ rating of effectiveness. Research question2: The stress level is affected by the sleeping time.
Case 2: Can you hear these words? Background: To test whether a hearing aid is right for a patient, audiologists play a tape on which words are pronounced at low volume. The patient tries to repeat the words. There are several different lists of words that are supposed to be equally difficult. Are the lists equally difficult when there is background noise? To find out, an experimenter had subjects with normal hearing listen to four lists with a noisy background.
Case 2 (cont) Data: The data set contains 96 responses. The experimenter assigns 96 subjects to 4 groups at random. Each group of 24 subjects listens to one of the lists. All individual listen and respond separately. Research question: Are the four lists are equally difficult?
Case 3: Plant density and cob weight Background: Twenty plots, each 10 x 4 meters, were randomly chosen in a large field of corn. For each plot, the plant density (number of plants in the plot) and the mean cob weight (gm of grain per cob) were observed.
Case 3 (cont) Data: a sample of size 20 was collected, as demonstrated below. Research question: Does plant density have an effect on cob weight?
Outlier x