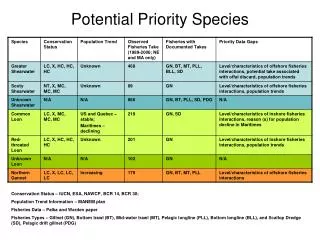
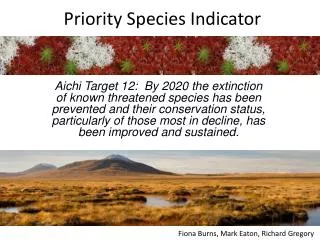
Priority Species Indicator
The aim was to prevent the extinction of known threatened species by 2020 while enhancing their conservation status, especially for those in decline. This report evaluates the current priority species indicators and discusses data availability, including quantitative (Tier 1) and qualitative (Tier 3) assessments. With about 2,900 priority species identified, it's crucial to synthesize and interpret this data effectively to track changes in species abundance and the overall health of biodiversity. The Conchological Society of Great Britain and Ireland provides insights into these critical conservation efforts.

Priority Species Indicator
E N D
Presentation Transcript
Priority Species Indicator Aichi Target 12: By 2020 the extinction of known threatened species has been prevented and their conservation status, particularly of those most in decline, has been improved and sustained. Fiona Burns, Mark Eaton, Richard Gregory
What have we used in the past? Unknown Decreasing Stable Increasing • Species List – UK BAP • Approach – Best available information or expert assessment • Coverage – Most BAP species • Frequency – Last updated in 2008 Number of Species Current Priority Species Indicator – BIYP 2012 Earliest available assessment Most recent assessment
What do we know about the status of threatened species? ~2900 Priority Species (S41, S42, SBL, NIBL) Quantitative Data Abundance data (Tier 1) Distribution data (Tier 2) Qualitative data (Tier 3) Species Indicator?
Species Abundance Data – Tier 1 • Data availability • around 5% of threatened data • Covering a large proportion of threatened birds, mammals, butterflies & moths • Approach • Combine species indices using a geometric mean similar to current biodiversity indicators • Technical issues to overcome • Variable time periods • How to estimate variance Number of species
Qualitative Assessments – Tier 3 • Very important group of species, many of these species are those at greatest risk of extinction • At present this group constitute a large proportion of threatened species • Covers a wide range of species • Rare and range restricted • Challenging to survey • Lack of attention Number of species
Questions to think about • We can produce composite indices charting changes in species abundance • How do we interpret this, does a straight line mean a smiley face? • Can we use this to make more general conclusions about the changing status of threatened species? • How do we display and interpret the information generated from the three types of data? • How will the data availability and analysis methods change in the coming years and how will this impact the indicator? ?