Demographic Transition Model
Demographic Transition Model. Demographic Transition Model. The "Demographic Transition" is a model that describes population change over time. It is based on an interpretation begun in 1929 by the American demographer Warren Thompson.


Demographic Transition Model
E N D
Presentation Transcript
Demographic Transition Model • The "Demographic Transition" is a model that describes population change over time. • It is based on an interpretation begun in 1929 by the American demographer Warren Thompson. • By "model" we mean that it is an idealized, composite picture of population change in these countries.
The model makes assumptions • The demographic transition model is a generalization that applies to MEDC’s as a group and may not accurately describe all individual cases. • Whether or not it applies to LEDC’s today remains to be seen.
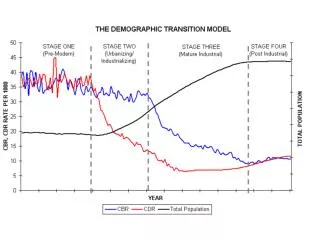
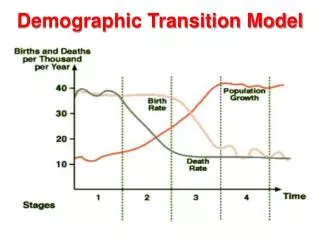
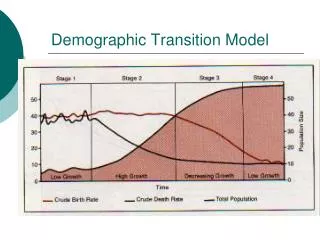
1st Stage (1850-1880): Characteristic of traditional agrarian societies, birth rates and death rates are high, little net population growth. 2nd Stage (1880-1960): Death rates began declining as health and standard of living increased. The population growth rates began increasing. 3rd Stage (1960-present?): The birth rate declined with urbanization and economic change resulting in a lower rate of population growth. 4th Stage: Low birth rates, low death rates, and low rates of natural increase. In some cases the population declines.
Stage 1 Stage 2 Stage 3 Stage 4 Birth rate Natural increase The Classic Stages of Demographic Transition Death rate Time Note: Natural increase is produced from the excess of births over deaths. Lesson Plan: The Demographic Transition, Activity One
Pre-industrial stage • Birth rates and death rates are both high. Modern medicine had not yet developed Low standards of personal hygiene High Infant Mortality Rates Need for children in the fields working No contraceptives available There is little population growth.
Transitional Stage The death rate decreased. • Industrialization began • food production rose • Standards of hygiene improved • more modern medical techniques began to drive the death rate down. • The birth rate remained high, as much of the economy was based on agriculture. • There is a significant upward trend in population size.
Industrial Stage • Urbanization decreases the economic “need” for large families. • The birth rate started to drop. There is better access to birth control lower infant mortality rates More roles and higher education for women. The birth rate is goes down, and the death rate continues to go down, so the population growth is slower. (Most MEDC’s are at this stage now.)
Postindustrial Stage • The last stage of the demographic transition is characterized by a higher, but stable, population size. • Birth and death rates are both relatively low. In some cases, the birth rate is lower than the death rate and the population may decrease. • Examples of countries in this stage are Japan, Germany and Spain.
Births/Deaths per 1,000 1950 Demographic Transition in Sweden and Mexico Sources: B.R. Mitchell, European Historical Statistics 1750-1970 (1976): table B6; Council of Europe, Recent Demographic Developments in Europe 2001 (2001): tables T3.1 and T4.1; CELADE, Boletin demografico 69 (2002): tables 4 and 7; Francisco Alba-Hernandez, La poblacion de Mexico (1976): 14; and UN Population Division, World Population Prospects: The 2002 Revision (2003): 326. Lesson Plan: The Demographic Transition, Activity One
Strategies to limit population growth in stages 3 and 4 • Increasing education levels, especially for women • Increasing marriage age and generation time • Birth control and family planning • National birth rate reduction programs • Increasing affluence Urbanization
Replacement-level Fertility • Replacement -level fertility is the number of children that a couple must have to replace themselves. • 2.1 in MEDC’s and 2.5 in some MEDC’s. • Lowering fertility rates to replacement level does not halt population growth immediately if the population is young.
Total Fertility Rate • The average number of children that a woman will have. • In 2010, the world average was 2.5 per woman. • In MEDC’s, it was 1.7. • In LEDC’s, it was 2.6. • The highest rate is 5.3 in Sub Saharan Africa. • South America: 2.1
TFR and the future world population • TFR = 2.0 2150 population at 10.6 Billion TFR = 2.5 2150 population at 27 billion TFR = 1.5 2150 population at 3.1 billion
Limitations of the model: Development is currently happening faster now than it did in the past. Some Western countries exploited colonies and LEDC’s while they developed. Today’s LEDC’s cannot do the same thing. Natural resources are assumed to be available at the same amount now as in the past. Diseases such as HIV are not included in this model Local cultural and religious beliefs are not taken into consideration.