Download
1 / 8
80 likes | 171 Views
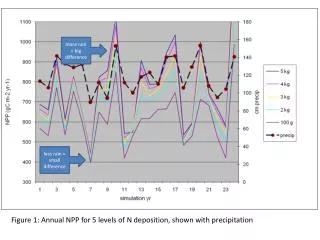
This study analyzes the effects of varying nitrogen deposition levels on ecosystem productivity, outflow, leaf area index, and soil carbon over a 25-year period. The results show significant changes in carbon sequestration and vegetation dynamics in response to different levels of nitrogen deposition and precipitation. Daily and monthly averages provide insights into the temporal variations in net primary productivity and respiration rates.

E N D
more rain = big difference less rain = small difference Figure 1: Annual NPP for 5 levels of N deposition, shown with precipitation
Ndep reduces outflow Figure 2: Annual Outflow for 5 levels of N deposition, shown with precipitation
Figure 3: Annual Max LAI for 5 levels of N deposition over 25 yrs
Figure 4: Soil Carbon for 5 levels of N deposition over 25 yrs
Figure 5: Daily NPP and monthly moving averages for 5 levels of N deposition over one year
Figure 6: Daily HR and monthly moving averages for 5 levels of N deposition over one year
HR is ¼ of difference Diff ~ .0005 Diff ~ .002
MR is ¾ of difference Diff ~ .0015 Diff ~ .002