Download
1 / 15
150 likes | 277 Views
In this guided inquiry lesson, students will design and conduct an experiment to test the freshness of cranberries for Walmart. They will ask a testable question, plan and implement the experiment, make reasonable explanations supported by evidence, communicate valid conclusions, construct graphs, maintain a science journal, summarize information, and evaluate their work. The lesson involves brainstorming ways to test cranberries, identifying variables to change/control, asking a scientific question, making predictions, setting up the experiment, recording observations in a data table, looking for patterns, graphing results, and answering the experimental question using data and graphs. Through this investigation, students will learn about cranberries, scientific inquiry, experimental design, data analysis, and communication of findings.

E N D
Guided InquiryCranberry Bounce Investigation In this lesson you will Ask a question that can be tested (5.2A) Plan and implement an experiment (5.2A) Collect information by observing and measuring (5.2B) Make a reasonable explanation from the information using direct and indirect evidence (5.2C) Communicate valid conclusions about your question supported by evidence from your experiment(5.2D) Construct graphs to organize your data (5.2E) Maintain a science journal throughout the investigation (5.2D) Summarize and organize information to present on a science display board (LA 5.13E and 5.21E) Evaluate your work
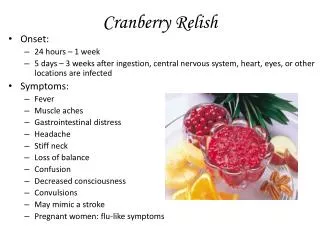
True or False The cranberry is our only native American berry. Cranberries were given to the Pilgrims at the first Thanksgiving in 1621. Cranberries are rich in vitamin C. Cranberries grow in wetland areas called bogs. Once established and cared for, cranberry plants will continue to produce fruit for as long as 100 years.
Cranberry bog Cranberry plant Harvesting cranberries by flooding the bog
In a 12 ounce bag of cranberries, how many are fresh? Walmart sells lots of cranberries at Thanksgiving and they need to know if the bags of cranberries they are selling contain fresh berries. They have asked you for help. Design a way to help Walmart test their cranberries.
BRAINSTORM Brainstorm ways to test the cranberries. What will you measure or observe?
CHOOSE VARIABLES What will you change? (manipulated variables) The manipulated variable is the one thing that is changed in an experiment. What will you measure or observe? (responding variables) The responding variable is what may respond to the change in the experiment. What will you keep the same? (controlled variables) Controlled variables are the things that must not be changed in order for the experiment to be fair.
ASK A QUESTION A scientific question asks what the effect of the manipulated variable will be on the responding variable. Check your question. Is it something that can be tested in an experiment?
PREDICT AN OUTCOMEAlso known as forming a HYPOTHESIS Making predictions is an important part of any experiment. Think about what makes sense to you. Connect the prediction to what you know . It does not have to be “right”. All predictions are acceptable as long as you justify your thinking. This might help you: When I ________________________ , (manipulated variable) I predict that _____________________(respondingvariable) because …
SET UP EXPERIMENT Explain how you will conduct your experiment with diagrams that are labeled and in words. Report how you will change the manipulated variable and keep the controlled variables the same. Be very clear and concise. Ask yourself, could another scientist repeat this experiment exactly using my explanation?
TABLE OF RESULTS Once the experiment is set up, record your observations. Make a data table like the one below to identify the manipulated and responding variables. Add additional columns as needed. For example, if you are planning more than one observation. Or, you notice important things to record during the experiment.
LOOK FOR PATTERNS AND GRAPH RESULTS After the experiment is completed represent your results in a graph. The graph will show the relationship between the manipulated variable (what you changed) and the responding variable (what was measured). Think about the best type of graph to use, bar graph or line graph. Remember that your graph is the visual that shows patterns and trends in your data and is an important tool for answering your question.
ANSWER THE QUESTIONUse your data table and graph to answer your original experimental question. When I ………….. This is what happened …….. Here’s what the graph tells me ……… You might notice that answering the original question will make you think of more questions. That is the nature of science! Scientific investigations usually include many ongoing experiments that build on each other.