Download
1 / 35
560 likes | 1.18k Views
CLIM 101: Weather, Climate and Global Society. Adaptation and Mitigation of Global Climate Change (2). Emilia Jin. Lecture 23: Nov 19, 2009. Adaptation & Mitigation.

E N D
CLIM 101: Weather, Climate and Global Society Adaptation and Mitigation of Global Climate Change (2) Emilia Jin Lecture 23: Nov 19, 2009
Adaptation & Mitigation • Adaptation: initiatives and measures to reduce the vulnerability of natural and human systems against actual or expected climate change effects • Mitigation: actions to reduce greenhouse gas emissions and to enhance sinks aimed at reducing the extent of climate change
Past, present and future: emission trends • Emissions of the GHGs increased by about 70% from 1970–2004 (by 24% from 1990–2004), with carbon dioxide (CO2) being the largest source, having grown by about 80%. • The largest growth in CO2 emissions has come from power generation and road transport. • Methane (CH4) emissions rose by about 40% from 1970, with an 85% increase from the combustion and use of fossil fuels. Agriculture, however, is the largest source of CH4 emissions. • Nitrous oxide (N2O) emissions grew by about 50%, due mainly to increased use of fertilizer and the growth of agriculture. Industrial emission of N2O fell during this period. • Emissions of ozone-depleting substances (ODS) controlled under the Montreal Protocol (which includes CFCs, HCFCs), increased from a low level in 1970 to about 7.5 GtCO2-eq in 1990, but then decreased to about 1.5 GtCO2-eq in 2004, and are projected to decrease further due to the phase-out of CFCs in developing countries. • Emissions of the fluorinated gases (F-gases) (HFCs, PFCs, and SF6) controlled under the Kyoto Protocol grew rapidly (primarily HFCs) during the 1990s as they replaced ODS to a substantial extent and were estimated at about 0.5 GtCO2eq in 2004.
Understanding the Goals Slow Progress • Stabilizing emissions • Stabilizing concentrations • Stabilizing temperature
Stabilization Activities Wedge Strategy (Pacala and Socolow 2004)
Stabilization Activities Wedge Strategy (Pacala and Socolow 2004) • Efficiency and Transport • Doubling vehicle fuel economy and Cutting the distance driven per car in half (2) • Installing lights and appliances with state-of-the-art energy efficiency • Improving the efficiency of coal-fired power plants • Renewable energy • A 50-fod expansion in wind energy (2) • A 700-fod expansion of photovoltaic (PV) solar energy • A 50-fod expansion in ethanol • A halting of current deforestation • Employing conservation tillage • Replacing the amount of energy now generated • by nuclear sources • Quadrupling the use of natural gas • Sequestration (3)
Energy supply • Global energy demand continues to grow, but with regional differences. • Rapid growth in energy consumption per capita is occurring in many developing countries. • Africa is the region with the lowest per capita consumption. Increasing prices of oil and gas compromise energy access, equity and sustainable development of the poorest countries and interfere with reaching povertyreduction targets that, in turn, imply improved access to electricity, modern cooking and heating fuels and transportation
Annual primary energy consumption From 1971 to 2003 EECCA = countries of Eastern Europe, the Caucasus and Central Asia
World primary energy consumption by fuel type • Large hydro and geothermal energy are relatively static. • Wind and solar are growing most rapidly, but from a very low base.
Future of Fossil Fuel • New technology: Coal gasification synfuels • Sequestration: Carbon Capturing and Storage (CCS) • Ocean storage: environmental issues (e.g. acidification) • Underground Storage: depleted oil and gas wells or saline aquifers • Next generation coal plant with integrated gasificatoin and combined cycle
Renewable Energy Consideration • Generating time • Reliability • Public safety • Roll-out time
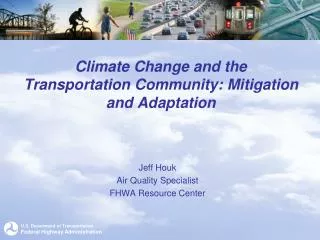
Transport and its infrastructure • Transport activity is increasing around the world as economies grow. • Unless there is a major shift away from current patterns of energy use, projections foresee a continued growth in world transportation energy use of 2% per year, with energy use and carbon emissions about 80% above 2002 levels by 2030. • Increasing speed has generally led to greater energy intensity and higher GHG emissions. • In addition to GHG emissions, the motorization of transport has created congestion and air-pollution problems in large cities all around the world.
Vehicle ownership and income per capita Data are for 1900–2002, but the years plotted vary by country, depending on data availability
Green Transportation Options • Raise efficiency • Hybrid cars • Hydrogen power • Biofuel: ethanol, cellulosic ethanol, biodiesel, etc. • Demand for land • Cross-sectional issues (food supply)
Comparison between current and future biofuel production costs vs. gasoline and diesel ex-refinery (FOB) prices • Biofuels have the potential to replace a substantial part, but not all, petroleum use by transport. The potential strongly depends on production efficiency, the development of advanced techniques. Currently the cost and performance of ethanol in terms of CO2 emissions avoided is unfavourable, except for production from sugarcane in lowwage ountries.
Residual and Commercial buildings • Substantial CO2 emission reduction from energy use in buildings can be achieved over the coming years compared with projected emissions. • The considerable experience in a wide variety of technologies, practices and systems for energy efficiency and an equally rich experience with policies and programmes that promote energy efficiency in buildings lend considerable confidence to this view. • A significant portion of these savings can be achieved in ways that reduce life-cycle costs, thus providing reductions in CO2 emissions that have a net negative cost (generally higher investment cost but lower operating cost). • Strategies: • Installing high-performance windows • Demolishing about 14% of current houses • Employing low- or no-carbon technologies
CO2 emissions from buildings including emissions from the use of electricity (1971-2030) Dark red – historic emissions; light red – projection according to SRES B2 scenario
Geoengineering : Reducing the amount of carbon in the atmosphere • Expose the atmosphere to chemicals • To convert CO2 as solid form 2. Reduce amount of sunlight reaching Earth • Inject sulfur particles into the upper atmosphere reflect solar radiation (Volcanoes) • Spray sea water increase reflectivity of marine stratus clouds reflect solar radiation (1500 ships ~ increase reflectivity by 10%) • White roof tops
Industry • Energy-intensive industries, iron and steel, non-ferrous metals, chemicals and fertilizer, petroleum-refining, cement, and pulp and paper, account for about 85% of the industry sector’s energy consumption in most countries. • Since energy use in other sectors grew faster, the sector’s share in global primary energy use declined from 40% in 1971 to 37% in 2004. • Much of this energy-intensive industry is now located in developing countries. In 2004, developing countries accounted for 46% of final energy use by industry, developed country for 43% and economies in transition for 11%. • Many facilities (for aluminium, cement and fertilizer industries) in developing nations are new and include the latest technology with lowest specific energy use. However, as in industrialized countries, many older, inefficient facilities remain. This creates a huge demand for investment in developing countries to improve energy efficiency and achieve emission reductions.
Industrial sector energy-related CO2 emissions including electricity use (1971–2030) Dark red – historic emissions; light red – projection according to SRES B2 scenario
Agriculture • Technological developments have allowed remarkable progress in agricultural output per unit of land, increasing per capita food availability despite a consistent decline in per capita agricultural land area. • Production of food and fibre has more than kept pace with the sharp increase in demand in a more populated world, so that the global average daily availability of calories per capita has increased, though with regional exceptions. • Economic growth and changing lifestyles in some developing countries are causing a growing demand for meat and dairy products. • However, progress has been uneven across the world, with rural poverty and malnutrition remaining in some countries.
Mitigation Options of Agriculture • The most prominent mitigation options in agriculture: • restoration of cultivated organic soils • improved cropland management (including agronomy, nutrient management, tillage/residue management and water management (including irrigation and drainage) and set-aside / agro-forestry • improved grazing land management (including grazing intensity, increased productivity, nutrient management, fire management and species introduction • restoration of degraded lands (using erosion control, organic amendments and nutrient amendments).
Historic and projected N2O and CH4 emissions in the agricultural sector, 1990–2020 Dark red – historic emissions; light red – projection according to SRES B2 scenario
Forestry • On the global scale, during the last decade of the 20th century, deforestation in the tropics and forest regrowth in the temperate zone and parts of the boreal zone remained the major factors responsible for CO2 emissions and removals, respectively. • The growing understanding of the complexity of the effects of land-surface change on the climate system shows the importance of considering the role of surface albedo, the fluxes of sensible and latent heat, evaporation and other factors in formulating policy for climate change mitigation in the forest sector. • Options available to reduce emissions by sources and/or increase removals by sinks in the forest sector are grouped into four general categories: • maintaining or increasing the forest area • maintaining or increasing the site-level carbon density • maintaining or increasing the landscape-level carbon density • increasing off-site carbon stocks in wood products and enhancing product and fuel substitution.
Historical forest carbon balance, 1855–2000 Green = sink; Data averaged per 5-year period; year marks starting year of period.
Generalized summary of the options available in the forestsector
Waste Management • Waste generation is related to population, affluence and urbanization. • Rates have been increasing in recent years, especially in developing countries with rapid population growth, economic growth and urbanization. • In highly developed countries, a current goal is to decouple waste generation from economic driving forces such as GDP — recent trends suggest that per capita rates of post-consumer waste generation may be peaking as a result of recycling, re-use, waste minimization, and other initiatives • Post-consumer waste is a small contributor to global GHG emissions (<5%), with landfill CH4 accounting for >50% of current emissions. Secondary sources of emissions are wastewater CH4 and N2O; in addition, minor emissions of CO2 result from incineration of waste containing fossil carbon. • It is important to emphasize that post-consumer waste constitutes a significant renewable energy resource that can be exploited through thermal processes (incineration and industrial co-combustion), landfill gas utilization and use of anaerobic digester biogas.
Estimated sectoral economic potential for global mitigation for different regions in 2030 OECD: Organization for Economic Co-operation and Development EIT: Economy in Transition
Cumulative emission reductions for alternative mitigation carbon capture and storage from biomass. Dark bars denote reductions for a target of 650 ppm CO2-eq and light bars the additional reductions to achieve 490–540 ppm CO2-eq.
Mitigation from a cross-sectoral perspective • While many of the technological, behavioural and policy options mentioned, some technologies and policies reach across many sectors; for example, the use of biomass and the switch from highcarbon fuels to gas affect energy supply, transport, industry and buildings. • Bio-energy options are important for many sectors by 2030, with substantial growth potential beyond. • Key preconditions for such contributions are the development of biomass capacity (energy crops) in balance with investments in agricultural practices, logistic capacity and markets, together with commercialization of second-generation biofuel production. • Sustainable biomass production and use could ensure that issues in relation to competition for land and food, water resources, biodiversity and socio-economic impacts are not creating obstacles
National and International Responses • Global energy use and supply – the main drivers of GHG emissions – is projected to continue to grow, especially as developing countries pursue industrialization. • Developing countries (e.g., Brazil, China, India and Mexico) that have undertaken efforts have reduced their emissions growth over the past three decades. Many of these efforts are motivated by economic development and poverty alleviation, energy security and local environmental protection. • There are voluntary international initiatives to develop and implement new technologies to reduce GHG emissions. • Carbon Sequestration Leadership Forum (promoting CO2 capture and storage) • Hydrogen partnership; • Methane to Markets Partnership, • Asia-Pacific Partnership for Clean Development and Climate (2005 • Climate change has also become an important growing concern of the G8 since its meeting in Gleneagles, Scotland in 2005: At that meeting, a plan of action was developed which tasked the International Energy Agency, the World Bank and the Renewable Energy and Energy Efficiency Partnership with supporting their efforts. • Gleneagles created a Clean Energy • Climate Change and Sustainable Development • Dialogue process for the largest emitters:The International Energy Agency (IEA) and the World Bank were charged with advising that dialogue process
International Responses: UNFCCC • The United Nations Framework Convention on Climate Change (UNFCCC) is the main vehicle for promoting international responses to climate change. • It entered into force in March 1994 and has achieved near universal ratification – 189 of the 194 UN member states (December 2006). • The Kyoto Protocol was adopted in 1997 and entered into force in February 2005. • As of February 2007, 168 states and the European Economic Community have ratified the Protocol. Under Article 3.1 of the Kyoto Protocol, Annex I Parties in aggregate agreed to reduce their overall GHG emissions to at least 5% below 1990 levels. • The entry into force of the Kyoto Protocol marks a first, though modest, step towards achieving the ultimate objective of the UFCCC to avoid dangerous anthropogenic interference with the climate system. • Its full implementation by all the Protocol signatories, however, would still be far from reversing overall global GHG-emission trends. • The strengths of the Kyoto Protocol are its provision for market mechanisms such as GHG-emission trading and its institutional architecture. • One weakness of the Protocol, however, is its non-ratification by some significant GHG emitters.
THANK YOU! ANY QUESTIONS?