Download
1 / 48
480 likes | 594 Views
The Dual Public Health Crises of Hunger & Obesity. Ending Hunger in Oregon: 2012 Food Security Summit Corvallis, OR. January 19, 2011 Alejandro Queral , Northwest Health Foundation Laurie Trieger, Lane Coalition for Healthy Active Youth (LCHAY).

E N D
The Dual Public Health Crises of Hunger & Obesity Ending Hunger in Oregon: 2012 Food Security Summit Corvallis, OR. January 19, 2011 Alejandro Queral, Northwest Health Foundation Laurie Trieger, Lane Coalition for Healthy Active Youth (LCHAY)
At least 50% of our health is determined by socio-economic and environmental factors. • Health behaviors heavily influenced by social and economic environment. • Therefore, to have greatest impact on health outcomes, focus should be on factors that most affect health.
The Obesity Epidemic • In the US • Among children
Obesity Trends Among U.S. Adults* BRFSS, 1990 (*BMI ≥30, or ~ 30 lbs. overweight for 5’ 4” person) No Data <10% 10%–14%
Obesity Trends Among U.S. Adults* BRFSS, 1991 (*BMI ≥30, or ~ 30 lbs. overweight for 5’ 4” person) No Data <10% 10%–14% 15%–19
Obesity Trends Among U.S. Adults* BRFSS, 1992 (*BMI ≥30, or ~ 30 lbs. overweight for 5’ 4” person) No Data <10% 10%–14% 15%–19%
Obesity Trends Among U.S. Adults* BRFSS, 1993 (*BMI ≥30, or ~ 30 lbs. overweight for 5’ 4” person) No Data <10% 10%–14% 15%–19%
Obesity Trends Among U.S. Adults* BRFSS, 1994 (*BMI ≥30, or ~ 30 lbs. overweight for 5’ 4” person) No Data <10% 10%–14% 15%–19%
Obesity Trends Among U.S. Adults* BRFSS, 1995 (*BMI ≥30, or ~ 30 lbs. overweight for 5’ 4” person) No Data <10% 10%–14% 15%–19%
Obesity Trends Among U.S. Adults* BRFSS, 1996 (*BMI ≥30, or ~ 30 lbs. overweight for 5’ 4” person) No Data <10% 10%–14% 15%–19%
Obesity Trends Among U.S. Adults* BRFSS, 1997 (*BMI ≥30, or ~ 30 lbs. overweight for 5’ 4” person) No Data <10% 10%–14% 15%–19% 20%–24%
Obesity Trends Among U.S. Adults* BRFSS, 1998 (*BMI ≥30, or ~ 30 lbs. overweight for 5’ 4” person) No Data <10% 10%–14% 15%–19% 20%–24%
Obesity Trends Among U.S. Adults* BRFSS, 1999 (*BMI ≥30, or ~ 30 lbs. overweight for 5’ 4” person) No Data <10% 10%–14% 15%–19% 20%–24%
Obesity Trends Among U.S. Adults* BRFSS, 2000 (*BMI ≥30, or ~ 30 lbs. overweight for 5’ 4” person) No Data <10% 10%–14% 15%–19% 20%–24%
Obesity Trends Among U.S. Adults* BRFSS, 2001 (*BMI ≥30, or ~ 30 lbs. overweight for 5’ 4” person) No Data <10% 10%–14% 15%–19% 20%–24% 25%–29%
Obesity Trends Among U.S. Adults* BRFSS, 2002 (*BMI ≥30, or ~ 30 lbs. overweight for 5’ 4” person) No Data <10% 10%–14% 15%–19% 20%–24% 25%–29%
Obesity Trends Among U.S. Adults* BRFSS, 2003 (*BMI ≥30, or ~ 30 lbs. overweight for 5’ 4” person) No Data <10% 10%–14% 15%–19% 20%–24% 25%–29%
Obesity Trends Among U.S. Adults* BRFSS, 2004 (*BMI ≥30, or ~ 30 lbs. overweight for 5’ 4” person) No Data <10% 10%–14% 15%–19% 20%–24% 25%–29%
Obesity Trends Among U.S. Adults* BRFSS, 2005 (*BMI ≥30, or ~ 30 lbs. overweight for 5’ 4” person) No Data <10% 10%–14% 15%–19% 20%–24% 25%–29% ≥30%
Obesity Trends Among U.S. Adults* BRFSS, 2006 (*BMI ≥30, or ~ 30 lbs. overweight for 5’ 4” person) (*BMI ≥30, or ~ 30 lbs. overweight for 5’ 4” person) No Data <10% 10%–14% 15%–19% 20%–24% 25%–29% ≥30%
Obesity Trends Among U.S. Adults* BRFSS, 2007 (*BMI ≥30, or ~ 30 lbs. overweight for 5’ 4” person) No Data <10% 10%–14% 15%–19% 20%–24% 25%–29% ≥30%
Obesity Trends Among U.S. Adults* BRFSS, 2008 (*BMI ≥30, or ~ 30 lbs. overweight for 5’ 4” person) No Data <10% 10%–14% 15%–19% 20%–24% 25%–29% ≥30%
Obesity Trends Among U.S. Adults* BRFSS, 2009 (*BMI ≥30, or ~ 30 lbs. overweight for 5’ 4” person) No Data <10% 10%–14% 15%–19% 20%–24% 25%–29% ≥30%
Obesity Trends* Among U.S. AdultsBRFSS, 2010 (*BMI ≥30, or ~ 30 lbs. overweight for 5’ 4” person) No Data <10% 10%–14% 15%–19% 20%–24% 25%–29% ≥30%
Obesity Trends* Among U.S. AdultsBRFSS,1990, 2000, 2010 (*BMI 30, or about 30 lbs. overweight for 5’4” person) 2000 1990 2010 No Data <10% 10%–14% 15%–19% 20%–24% 25%–29% ≥30%
Lane County , OR. Childhood Obesity Incidence The sample (n = 10,853) represents students from 56% of the school districts in Lane County. LCHAY BMI data collection project, 2005-06. G. Moreno, PhD,CNS and T. Brooks, MD LCHAY weighed and measured ¼ of all Lane County K-8th Graders 37% at risk, overweight/obese
Leading Causes of PreventableDeath in the U.S. JAMA, March 10, 2004 Vol 291, No.10
Both hunger and obesity can be consequences of low income coupled with lack of access to enough nutritious food.
Low income women more likely to be obese – is food insecurity a driver? Research: higher prevalence of obesity among food insecure women. Research: children born to mothers who consumed an unhealthy diet during pregnancy have an increased risk of type 2 diabetes (a significant contributing factor to heart disease and cancer) later in life.
Obesity as a major driver of rising health care costs • In Oregon, estimated medical costs related to obesity among adults were $781 million for 2003, representing 5.7% of Oregon’s total health care bill. • For Oregon, Medicare obesity-attributable medical expenditures were estimated at $145 million, representing 6% of Medicare costs. • $180 million of obesity-related care was financed by Medicaid, representing 8.8% of Medicaid costs in Oregon. • Source: Finkelstein E, Fiebelkorn I, Wang G. State-level estimates of annual medical expenditures attributable • to obesity. Obesity Research. 2004;12:18-24.
Obesity as a major driver of rising health care costs • Rising rates of obesity rise in clinical incidence and prevalence of key chronic diseases (diabetes, hypertension, hyperlipidemia, pulmonary disease and co-morbid depression. • Higher rate of disease prevalence accounts for about 1/3 of the rise in health care spending between 1998 and 2005. • In other words, the rise of obesity accounted for nearly 34 percent of the real per capita growth in health care spending • Source: Thorpe, K and K. Galactionova. The Impact of Obesity on Rising Medical Spending in Oregon from 1998 to 2005. Study commissioned by Northwest Health Foundation. 6 April 2009.
Poor health as driver of food insecurity Over 6,000 Oregonians receiving food boxes surveyed: 25% cited “High medical costs” as reason for needing food box 15% responded they are “Too sick to work” 41% of emergency food box recipients indicated they have medical debt SOURCE: Oregon Food Bank, Profiles of Hunger & Poverty in Oregon, 2012 Hunger Factors Assessment Survey
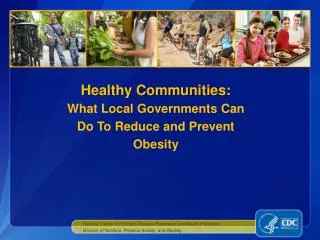
Shared solutions Using policy and environment change to address hunger and obesity
"Give a man a fish and he will eat for a day. Teach a man to fish and he will eat for the rest of his life.“ -Chinese Proverb
What Will Turn the Tide? Despite positive changes in emergency food system and federal nutrition programs over past 10 years; we still have rising rates of both hunger and obesity. Why…? …and what can be done?
What key policy priorities can address food insecurity and obesity? • We know that: • Poverty is a factor in both food insecurity and female obesity. • Children of obese females more likely to become obese themselves. • Children born to females who either grew up or gestated in a poor nutritional environment are more likely to develop chronic disease (like Type II diabetes).
Questions to Consider • We’ve always had poverty, but the obesity epidemic is relatively recent. What is different about now, versus one generation (and more) ago? • There are great projects happening across Oregon that improve access to more nutritious foods, especially fresh fruits & veg. What can be done to drive up demand for “a different way of eating”? • How does/can the emergency food distribution system serve as a tool for prevention of diet related diseases? • What policy approaches can (positively) impact both hunger & obesity? • What can we learn from the success of the WIC Program, with its laser-focus on both a specific vulnerable population and on prescriptive food items- that might transfer to other existing programs; or help create new policies or programs? • Basic, nutritious foods are affordable (think: rice & beans & cabbage). But there are reasons why we do not consume these foods. Discuss the social, cultural, or other influences on our food choices. In other words- what is available, promoted, and consumed; and how is that so?
Thank You Alejandro Queral Northwest Health Foundation 971-230-1288 aqueral@nwhf.org Laurie Trieger Lane Coalition for Healthy Active Youth 541.682.4306 laurie@lchay.org Nancy Becker Oregon’s Public Health Institute 503.422.2482 nancy@orphi.org