Download
1 / 10
100 likes | 316 Views
RightNow 8 -- Adding a new report:. New > Report: OR Analytics > Reports > New Report. 3. 2. 1. New Report Types:. Report Designer:. Toolbar – double click tab to collapse items. Report Outline – add input filters. Design surface -- add output columns and define layout.

E N D
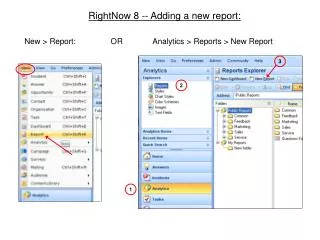
RightNow 8 -- Adding a new report: New > Report: OR Analytics > Reports > New Report 3 2 1
Report Designer: Toolbar – double click tab to collapse items Report Outline – add input filters Design surface -- add output columns and define layout Data Dictionary – select database tables and fields for your report
Add Filters and Search Criteria: This pop-up allows you to define the database field for your search criteria. Right click on Filters and select Add Filter OR Highlight Filters and click Add Filter
Filter Example for Answer Status Type: When you click OK, the filter displays in the Filters section AND the database table is added to the Current Dataset in the Data Dictionary.
Adding Output Columns: In the Data Dictionary, highlight a table name and drag and drop the output fields onto the design surface. The Current Dataset lists tables already used in your report. Use the All Tables or Customize link to select additional tables if necessary.
Edit Column Format: Right click on a column and select Edit Format to customize the output.
Define How Records are Sorted: Click the Data tab and then the Sort button.
Set Which Staff Can Open and Edit: Click the Properties tab and then Permissions. By profile, you can allow the ability to open (run) the report or to edit it.
Save Your Report: Click the Save icon and select the location to save your report. You can add additional custom folders using the Reports Explorer.