Download
1 / 19
190 likes | 312 Views
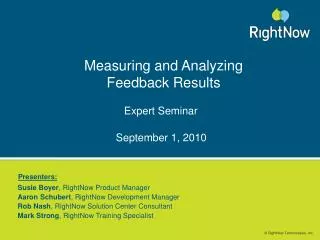
This expert seminar, held on September 1, 2010, featured key presentations from RightNow specialists including Susie Boyer, Aaron Schubert, Rob Nash, and Mark Strong. Attendees learned how to effectively report and break down feedback results, utilize Topic Monitoring best practices, and analyze data using 2009 benchmarks. The seminar addressed common questions from participants, explained survey composition, flow dynamics, and provided valuable insights for optimizing survey strategies. This event is a must-see for those looking to enhance their feedback analysis processes.

E N D
Measuring and AnalyzingFeedback Results Expert Seminar September 1, 2010 Presenters: • Susie Boyer, RightNow Product Manager • Aaron Schubert, RightNow Development Manager • Rob Nash, RightNow Solution Center Consultant • Mark Strong, RightNow Training Specialist
Agenda • Feedback reporting breakdown • Best practices for using Topic Monitoring • 2009 benchmarks • Answer questions posed on registration site • Answer other questions • Other Resources
Survey Aspects • What comprises a survey??? • Questionnaire • Each page in the questionnaire is analogous to a document in the system. The questionnaire can contain survey questions, conditional sections, merge fields, merge reports, tracked links, as well as any html content. • Flow • The flow describes the business rules that are defined which evaluate decisions and execute triggered actions. The flow effectively defines the way a user moves throughout the system. • Mailing (NA for website link survey) • Invitation message: Email message delivered to the contact which contains a link to the survey. Also represented as a document in the system. • Audience: Combination of segments and lists create the audience for a survey.
Survey Is Live… What Next? • Naturally we need to analyze results • Flow is the key • The survey results are all tied to the flow. This allows for the added benefit of utilizing survey questions in any item that contains a flow (currently used by campaigns as well). • Below example is the data set from the Survey Responses By Question canned report
Analyze Results I • Flow is the key. • Flows -> flow2question • Flow2question -> questions • flow2question: This table serves as a mapping for all questions in the survey. It is included for the purpose of ordering the results • questions: Only included to retrieve question names
Analyze Results II • Flow is still the key • If flows are so important, why is the surveys table in the dataset? • question_sessions: Contains summary data for all survey submissions. Also stores reference to survey trigger. • question_responses: Contains response data for each question answered in the session.
Analyze Results III • Why all the outer joins? • Question_choices • Only applicable for choice type questions • Question_rows • Only applicable for matrix type questions • Contacts • Only applicable for recognized survey takers • question_choices/rows: The main purpose is to show the text associated with each question choice/row.
Best Practices for Using Topic Monitoring Topic Monitoring Best Practices • Cluster on its own to see how the system would cluster without manual editing of themes • Drill down into those results and read some of the Answers to see if any themes stand out • See if there are some keywords that would be better on the Stop word list (like in our example we did the word "RightNow" made sense to be on the Stop word list) • Edit the Themes and re-cluster • It may take several reiterations of editing themes to get to a point where the results are clustered sensibly • At first the system cluster may not make too much sense but after look at some of the answers – themes start to show and then when you create your manual themes it really falls into place.
Questions from Event page • I had a question around scoring strategy. Is there a best practice around how to score your surveys rather than arbitrarily assigning succeeding values to answer options? Right now we have improvised a way in that negative feedback is scored greatly above positive feedback so that we can break out those surveys to address.
Questions from Event page In a report I'm trying to build, I've been unable to break down our survey results data into monthly time segments. I'm basically using the out of the box 'Transactional Survey Summary' report located within the following location: Public Reports > Feedback > Survey Performance I need to figure out how many surveys were sent/delivered and how many of those surveys were completed on the same report. Is this possible?
Other Questions • What could cause the stats from the out-of-the-box reports to be different from my custom report??
Other Questions • How can I report on survey results for the agent that was assigned the incident when the survey was actually sent?
Other Resources • RightNow Guide: How Improve Survey Participation by Leveraging Best Practices (on website under whitepapers) • RightNow Guide: 2009 RightNow Feedback Customer Benchmark Report (ask your Client Success Manager to review this document with you) • RightNow Guide: Creating Your Voice of the Customer Using RightNow (available starting September 1st on website and at the User Conference) • RightNow Library - http://community.rightnow.com/customer/library/presentations/ • Advanced Feedback (Summit 2008 Presentation) • Designing Programs that say “We Heard You” – Web Surveys (Summit 2008 Presentation) • Best Practices of RightNow Feedback (Summit 2009 Presentation) • Listen to Your Customers: Feedback 101 (Summit 2009 Presentation) • RightNow CX Feedback and Analytics Documentation • RightNow Customer Care • Your RightNow Customer Success Manager
Other Analytics Resources • Review past Expert Seminar: Gain performance & scalability with RightNow Analytics • RightNow Guide: How to Improve Reporting Performance • Advanced RightNow Analytics presentation from 2009 RightNow Summit • Customer Community > Library > Presentations > 2009 RightNow North America User Conference > Power Users > Advanced Analytics • Answers on RightNow Support Site: • Answer ID #2380 “Improving performance of reports and console view” • Answer ID #2817 “Operational vs. reporting database in RightNow Analytics” • Answer ID #2776 “Common questions regarding queued reports” • Answer ID #2149 “Receiving a message “Query processes too much data” • Answer ID #2223 “Analytics Error: Data Set has exceeded maximum size” • Answer ID #1266 “Impact of indexing a custom field” • Answer ID #1839 “Types of table joins used with reports and views” • Answer ID #2844 “Using the report analyzer with custom reports”