Download
1 / 13
130 likes | 239 Views
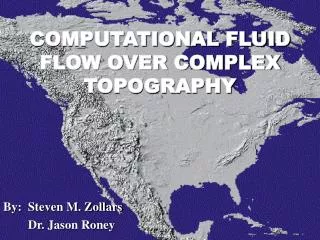
This project explores the application of Computational Fluid Dynamics (CFD) to analyze airflow over complex topography, specifically for optimizing wind turbine siting and improving wind energy predictions. We focus on prominent sites in California and Colorado, utilizing digital elevation maps to create detailed models. The findings aim to enhance the understanding of wind dynamics, reduce environmental impacts compared to traditional energy sources, and contribute to the cost-effectiveness of wind power, which has significant potential in Colorado.

E N D
COMPUTATIONAL FLUID FLOW OVER COMPLEX TOPOGRAPHY By: Steven M. Zollars Dr. Jason Roney
OVERVIEW • Problem Statement/Relevance • Methodology • My Progress/Setbacks • Summary • Questions
PROBLEM STATEMENT Implementing Computational Fluid Dynamics to Investigate Flow Over Complex Topography with Applications to Wind Turbine Sitings and Wind Energy Predictions
RELEVANCE • Wind Power is one of the most promising and cost effective renewable energy technologies available today • Environmental issues negligible compared to current energy sources (I.e. coal, nuclear, gas,..) • By 2005: Wind Power Costs = $0.02 per kWh • Colorado Potential: 481 billion kWh per year from wind
METHODOLOGY 1st Determine a site • Alamont Pass, California (East of San Francisco) • Tehachapi, California (Kern County) • San Gorgonio Pass (North of Palm Springs) • Ponnequin Wind Facility, Colorado (N.E. Colorado)
METHODOLOGY 2nd Download that sites .dem file (Digital Elevation Map)
METHODOLOGY 3rd Convert the .dem to a .vrt & .cel format using FORTRAN (or other operating mode) - Reformats the given information - allows us to plot a grid of points
METHODOLOGY 4th Import the data into StarCD - Creates a surface shell Mesh Grid
METHODOLOGY 5th Determine Boundary/Initial Conditions & run StarCD program
METHODOLOGY 6th Read output of StarCD and determine highest areas of wind velocity for future wind turbine sitings.
METHODOLOGY 7th Create a program that will determine the energy output from a wind turbine using MATLAB 8th Read output of StarCD into MATLAB to determine energy output of turbines located at different sites.
SUMMARY • Problem Statement/Relevance • Methodology • My Progress/Setbacks