Download
1 / 22
220 likes | 403 Views
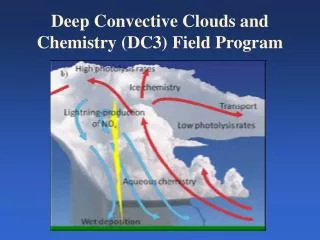
Modelling of deep convective clouds and orographic triggering of convection during the COPS experiment. Ralph Burton, NCAS (Leeds) Alan Gadian, NCAS (Leeds) Victoria Smith, ICAS, (Leeds) Stephen Mobbs, NCAS (Leeds). Outline of talk. 1. 15 th July – deep convection.

E N D
Modelling of deep convective clouds and orographic triggering of convection during the COPS experiment Ralph Burton, NCAS (Leeds) Alan Gadian, NCAS (Leeds) Victoria Smith, ICAS, (Leeds) Stephen Mobbs, NCAS (Leeds) This is the footer
Outline of talk. 1. 15th July – deep convection. 2. 12th August – outflows and convergence. 3. Summary. How well does WRF simulate these cases?
15th July: isolated deep convective cloud Note the location and orientation (SW-NEish) of the storm cloud From the Science Directory (Evelyne Richard) Summary
15th July: isolated deep convective cloud Observation of convective cloud, 15th July From the Science Directory (Evelyne Richard) Summary
15th July: isolated deep convective cloud? WRF convective cloud, 15th July
WRF: inner domain: 700m resolution Outer domain 6.3km 1st nest 2.1km
WRF: sensitivity tests – CAPE and wind vectors: 15Z Ferrier; Betts-Miller
WRF: skew-t and wind vectors: 15Z Isosurface of cloud water mixing ratio = 1E-4 kg/kg Cloud is quite shallow
Comparison with observational data: 2m temperatures. Black = obs.; red = WRF temperature time of day Many thanks to Simon Hölzl and Alex Göhm
Comparison with observational data: 2m temperatures. Black = obs.; red = WRF 669m 1000m 1156m temperature 842m 962m 798m 507m 667m 928m time of day Many thanks to Simon Hölzl and Alex Göhm
Comparison with observational data: 2m RH. Black = obs.; red = WRF 1156m 669m relative humidity time of day Many thanks to Simon Hölzl and Alex Göhm
Comparison with observational data: vertical profiles. OBS WRF
Objective analysis: forcing the analysis with observations. OBSGRID – Objective analysis. Boundary layer RH, outer domain. 06Z, 15th July Achern and Hornisgrinde Radiosonde data With thanks to Cindy Bruyere, NCAR
2m temps., wind vectors, orogrpahy. 1300Z 12th August. Note this cold area is over a roughly 2-D slope Relatively cool area
Conclusions 15th July • Area of high(er) CAPE in the region of the “cloud” location. • Zone of convergence at the cloud location. BUT • Sensitivity to model Cu and microphysics • Other sensitivities… • GFS analysis appears to be too dry. • WRF does not seem to agree with obs. at higher elevations ( > ~ 850-900m) quite so well: under-predicts the 2m temp and over-predicts the RH: evaporative cooling? • ECMWF T799 analysis – ready to try! • Objective analysis
12th August • Outflow from clouds in model • Outflows appear to convergence, and cloud formed as a result • Good comparison with remote sensing data • Again, model agrees with obs. at lower elevations better than at higher elevations. • Need higher temporal resolution runs (output every minute) to isolate the mechanisms of triggering.