Download
1 / 46
460 likes | 583 Views
Deep Convective Clouds and Chemistry (DC3) Field Experiment. Principal Investigators: Mary Barth and Chris Cantrell (NCAR) Bill Brune (PSU) Steve Rutledge (CSU).

E N D
Deep Convective Clouds and Chemistry (DC3) Field Experiment Principal Investigators: Mary Barth and Chris Cantrell (NCAR) Bill Brune (PSU) Steve Rutledge (CSU) Current Steering Committee: Mary Barth, Chris Cantrell, Bill Brune, Steve Rutledge, Jim Crawford, Owen Cooper, Alan Fried, Andrew Heymsfield, Paul Krehbiel, Don Lenschow, Laura Pan, Ken Pickering, Jeff Stith, Andy Weinheimer http://utls.tiimes.ucar.edu/Science/dc3.shmtl
Deep Convective Clouds and Chemistry (DC3) Field Experiment Characterize the effects of continental, midlatitude deep convection on the transport and transformation of atmospheric constituents throughout the troposphere http://utls.tiimes.ucar.edu/Science/dc3.shmtl
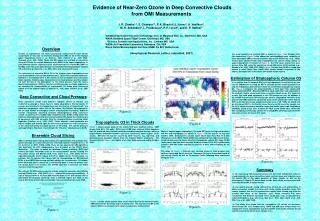
Motivation – Nitrogen Oxides Issues • NOx is critical for both tropospheric ozone and for atmospheric oxidation and their relations to climate. • Significant NOx was observed from convection from INTEX-A – widespread impact. (Bertram et al., 2007) • Lightning NOx appears to be greater than previously thought ( GEOS Chem; Hudman et al., Pickering) • Source amounts of NOx in the upper troposphere are uncertain. • Dust and other particle heterogeneous chemistry affects NOx/NOy partitioning. • OMI retrievals are influenced by the altitude of NO2. The convective NOx distributions for different types of convection and the effects of these different vertical distributions on OMI NO2 is needed.
Motivation – Nitrogen Oxides Issues OMI Tropospheric NO2 – long integration. from J. Gleason • Is the OMI-observed NO2 up high or down low or both? • Two continental sources – us & UT lightning? • What are the relative effects and values? • Low-level NO2 in midst of scattering; UT NO2 in clear air. • UT NO2 appears to be spread out - hard to separate tropospheric from the stratospheric contribution.
Motivation – Ozone issues • Tropospheric ozone is a potent greenhouse gas. • O3 production rates of several ppbv day-1 in UT downwind of convection is greater than previously expected. • Need better understanding of NOx and O3 precursors that are brought up by convection. • TES / NLDN / GEOSChem lightning / O3 link?
Enhanced Ozone layers in TES influenced by lightning Hysplit Trajectories from NDLN Flashes 07/08/2006 (subset) L. Jourdain, H. Worden, K. Pickering and the TES team; from K. Bowman Intersection between TES and trajectories from lightning flashes less than 5 days before TES Run 4497, 07/12/2006 Pressure
+AVK Troposphere 500 hPa-Tropopause Surface-500 hPA TES/GEOS-Chem Comparison (Run 4497) Influence from lightning Enhancement also seen In GEOS-Chem Results without lightning in GEOS-Chem +AVK +AVK +AVK GEOS-Chem run through TES viewing • Significant decrease ( ~10 ppbv) of the ozone enhancement in the GEOS-Chem simulation without lightning -> contribution of lightning in TES ozone
Motivation – Carbon Dioxide Issues • Paul Wennberg • Models are not able to simulate the observed vertical distribution of carbon dioxide throughout the troposphere – not enough in the upper troposphere. • Convection may be more active than currently thought. • Could have impact on OCO retrievals and interpretation of OCO observations
Motivation – Clouds and Aerosol • CALIPSO not applicable to direct comparison due to the laser’s narrow & widely spaced measurements. • CALIPSO data provides broad-scale information on the context of aerosol and clouds layers for the PBL and for high cloud properties and statistics. • Valuable to compare cloud property statistics derived from CALIPSO with those observed in situ from DC3 for scenes similar to those encountered during DC3 • In 2010, CALIPSO will have 5 seasons of measurements over the DC3 viewing area from which statistics of cloud properties can be derived for planning and comparison to DC3 observations. -- from C. Trepte
Motivation – Integrated Observing / Analysis System Altitude Ozone NO2 CO NO OH HO2 P(O3) CTM • Understanding & predictive capability for: • convection, lightning, & tropospheric composition • changes in anthropogenic impact
Goals of DC3 To integrate observations from aircraft, satellite, and ground-systems to understand the convection effect on atmospheric composition & its impact on climate & global oxidation capacity. To quantify the impact of continental, midlatitude convective storm dynamics, multiphase chemistry, lightning, & physics on the transport of chemical constituents to the upper troposphere. To determine the mass fluxes of air and trace gases into and out of the storm, including entrainment from the boundary layer, mid-troposphere, and stratosphere.
Goals of DC3 To determine the effects of convectively-perturbed air masses on ozone and its related chemistry in the midlatitude to the UT & LS near the convective cores (in the anvil region) and then sampled again 12-48 hours further downwind. To contrast the influence of different surface emission rates on the composition of convective outflow.
Ancillary Goals of DC3 • To improve our understanding of cloud electrification and lightning discharge processes (in relation to NO production; contrasting differences among different convective regimes) • To investigate the role of deep convection in contributing to the UT water vapor and in the transport of water vapor into the lowermost stratosphere • To connect aerosol and cloud droplet and ice particle number concentrations with convection characteristics and trace gas convective processing • To determine partitioning of reactive halogen and reservoir species in the UTLS
Figure 5. Schematic diagram of relation between DC3 facilities and a generic deep convective storm. DC3 Strategy Schematic Diagram
JJA Lightning Annual Average Precipitation DC3 Strategy : • One central aircraft base • Three surface sites with dual-Doppler radars: NE CO, Central OK, and Northern AL • Sufficient ground-based facilities • Good chance of convection occurring in one of the three places on any day • Contrast different environments (long-lived, shear storms vs airmass storms; high cloud bases vs low cloud bases; low chemical emissions vs higher emissions) • Collaborations: NSF, DOE? … • Time period : May & June 2010 Timing is likely good for several satellites!
DC3 Facilities: • Middle-to-High altitude aircraft with instruments for meteorology and composition: HIAPER • Low-to-Middle altitude aircraft with instruments for meteorology and composition: NASA DC-8 • Existing ground-based dual Doppler and polarimetric radars to examine convection, microphysics, and dynamics • Ground-based lightning mapping arrays • Other components being discussed • Ground precipitation network • DOE G-1 • NSF A-10, cloud penetration capability (if acquired and ready) • WB-57, to reach potential outflow at altitudes above HIAPER
Figure 1. The Northern Colorado Doppler radar network. From top, Cheyenne, WYWSR-88D (KCYS), PAWNEE, CSU-CHILL, and Denver, CO WSR-88D (KFTG). The circles depict the 30º dual-Doppler beam crossing angles for various radar pairs. DC3 Ground-based Capabilities: Dual-Doppler kinematics Microphysics from polarimetric radar Supplemented by NMIMT VHF Lightning Mapping Array characterize winds, hydrometeors, lightning frequency & location, thermodynamics, and species profiles Central to each of the 3 networks
DC3 Lightning Detection Capabilities: • National Lightning Detection Network (NLDN) • 2-D location of CG • Portable & fixed Lightning Mapping Arrays (LMAs) • 3-D mapping of IG, CG • Los Alamos Sferic Arrays • Dense arrays allow 3-D determination of IG, CG • Great Plains Network (GPN) (western CO, KS, OK) 2-D locations • Space-based detection (e.g. LIS on TRMM, OLS & VHF on FORTE) OK STEP LMA
A new observation of lightning – NBE’s • NBE = Narrow Bipolar Events • detected by NLDN as CG; not by LMA; by LASA as IC • Highly energetic, over small volumes, and extremely short times scales • Probably not significant NOx source, but…
Where DC3 is right now • Science Program Overview and Experimental Design Overview are 80% to 90% written and edited by the science team • April 2006: First community workshop was held at NCAR, with enthusiastic response • December 2006: First meeting with NSF • Coming soon: broader release of SPO & EDO for comment and improvement before submission in January 2008 • Need commitment from NASA for DC-8 soon
Summary for DC3 • addresses critical science issues in convection, clouds, & chemistry for the cloud & composition communities • is highly relevant to satellite measurements & science • should be done before a foreign convection mission • involves multi-agency, multi-program interest and cost-sharing • is a fairly mature US mission concept • may be joined to other US studies
Previous Studies of Convection and Chemistry • Comprehensive cloud and lightning with some chemistry information • STERAO, EULINOX, ELCHEM, TROCCINOX, SCOUT • Incomplete suite of chemistry measurements • Better airborne instruments now • Advent of lightning mapping array and polarized radar • Comprehensive chemistry with little cloud and lightning information • INTEX, TRACE-P • Incomplete information on storm dynamics, physics, and electrification
Candidate Aircraft Platforms • NSF/NCAR Gulfstream-V • Max altitude: 51kft; 45 kft w/ large payload • 450 ktas at higher altitudes • NASA DC-8 • Max altitude: 41 kft; reachable by middle of flights • 450 ktas at higher altitudes • Large payload capability (up to 30,000 lbs) including remote sensing
Goals of DC3 To quantify the impact of continental, midlatitude convective storm dynamics, multiphase chemistry, lightning, and physics on the transport of chemical constituents to the upper troposphere, How does tracer transport differ as a function of storm type?
Goals of DC3 To determine the mass fluxes of air and trace gases into and out of the storm, including entrainment from the boundary layer, mid-troposphere, and stratosphere What fraction of boundary layer air reaches the UTLS? What fraction of air in the storm is entrained from the sides? What part of the boundary layer is ingested by the storm? How much stratospheric O3 is entrained into the anvil? State-of-the-art motion detectors on the aircraft provides significant improvement in mass flux calc. Raymond and Wilkening, JAS, 1982
Goals of DC3 To determine the effects of convectively-perturbed air masses on ozone and its related chemistry in the midlatitude to the UT & LS near the convective cores (in the anvil region) and then sampled again 12-48 hours further downwind. CO at z = 10.6 km 00 Z 15 June 1985 06 Z 15 June 1985 Modeling study showing convectively-transported CO advection downwind of active convection. From Park et al. (2004) 12 Z 15 June 1985
Goals of DC3 To contrast the influence of different surface emission rates on the composition of convective outflow. NOx emissions Isoprene emissions
Candidate G-V Payload Red indicates important developments not yet fully funded
Candidate Typical G-V Flight Patterns Primarily High Altitude Sampling
Candidate Typical DC-8 Flight Patterns Primarily Mid & Low Altitude Sampling
Key coupling to chemistry – NOx generated by lightning and associated cloud transport Huffines and Orville, JAM 1999 Boccippio et al., MWR 2001 DC3 can systematically explore hypotheses regarding CAPE and CBH from SE U.S. through the Western High Plains. CCN and IN measurements will allow us to address hypotheses regarding role of coalescence in reducing cloud water in mixed phase region. CAPE, CBH
Figure 2. Map of fixed facilities now available to DC3 in Oklahoma and north Texas. The blue-shaded circle delineates the best region for polarimetric radar measurements by the KOUN radar in Norman, where the fast-scanning phased array radar (PAR) also is located. The purple circle (150 km in diameter) shows the region of three-dimensional lightning mapping by the OKLMA. Red circles show the approximate region in which three-dimensional mapping could be obtained if three mobile lightning mapping stations supplement the OKLMA in Oklahoma and Vaisala’s LDARII in north Texas. Green circles show the region within lightning mapping coverage in which operational WSR-88D radars could provide dual-Doppler coverage when supplemented by one mobile radar. (Two mobile radars would provide dual-Doppler coverage throughout the operational region.) Gray shading (small oval) shows the approximate area in which CASA X-band radars provide wind measurements at low altitudes. Small red-filled circles show the two ARM sites: the Kessler Farm (K. F.) and the central facility at Lamont. Not shown are Oklahoma mesonet sites, which provide surface wind and thermodynamic measurements on roughly a 50 km grid across Oklahoma. NSSL and OU facilities
MAX ? KHTX MIPS/NSSTC 68 km ARMOR RSA 75 KGWX DD lobe 1 km Res. 1.5 km Res. LMA 100-500 m MAX ARMOR NEXRAD KBMX UAH and MSFC facilities ARMOR
New Mexico Tech Lightning Mapping Array (LMA) • Time and 3-D location of VHF (60-66 MHz) lightning radiation sources (100s-1000s of sources per flash) • Maps total (IC and CG) lightning activity • Allows for computation of total flash rates • Allows inference of charge structure • Allows for determination of flash origin
STEPS Fixed Instrumentation: Triple-Doppler Network and LMA (VHF TOA) • At KGLD: • NWS • T-28 • NSSL • Electric field balloon • Mobile mesonet • MGLASS
Flashes Time interval shown: 10 minutes 150 flashes 36,000 sources Z Z X Color coded by time Y Z Courtesy K. Wiens
LMA charge structure methods • 1) Initiation in max E-field between charge regions of opposite polarity • 2) Bi-directional breakdown • 3) Negative breakdown is noisier at VHF Most LMA sources are negative breakdown through region of positive charge! Courtesy K. Wiens
Vertical structure of microphysical classification Hydrometeor type classification results for 5 July storm from STEPS (data from CSU-CHILL)—Model Intercomparison
29 June supercell “Macroscopic behavior” • Very strong correlation • between total flash rate and • graupel echo volume (and • also with updraft volume). • Some indication of lightning • “jumps” preceding severe • weather (i.e., hail). • Significant +CG activity began when hail developed and storm volume “exploded”. Peaks in +CG activity loosely followed updraft peaks.
29 June supercell LMA source density contours (log units) +CG mean origin heights (x’s) Max LMA sources at 7-10 km mid-level positive charge +CGs originate on lower end of this LMA source max. CG mean origin heights • +CGs originate from mid-levels (5-9 km) • -CGs originate from upper levels (9-12 km)
Possible Bases of Operation • Long runways at low altitude for hot afternoon take-offs • Proximity to study areas (~60 minutes) • Infrastructure for aircraft support; DOD contract fuel • Commercial flights • PI supplies (dry ice, liquid nitrogen, gases) • Single base to minimize duplication of PI setups • Wichita, Salina or Oklahoma City
STEPS LMA Network Colorado Kansas