Download
1 / 28
280 likes | 367 Views
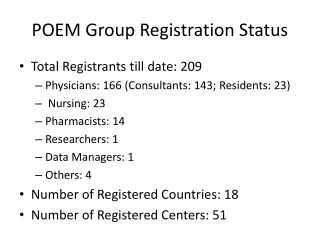
ABSORPTION LENGTH STATUS (group meeting) HAROLD YEPES RAMIREZ IFIC, December 17 th 2009. DATA TAKING There are not new optical properties runs available mean rates over the detector ~150 kHz. DATA ANALYSIS

E N D
ABSORPTION LENGTH STATUS (group meeting) HAROLD YEPES RAMIREZ IFIC, December 17th 2009
DATA TAKING • There are not new optical properties runs available mean rates over the detector ~150 kHz. • DATA ANALYSIS • First draft of absorption length paper for Nuclear Instruments and Methods Journal (from VLVnT09 proceedings) is ready for comments and corrections, deadline January 15th, to upload it into web page. • Checking the LEDs model for L12F2 beacon (KM3NeT prototype): • UV (Cleaved) 950 nJ • CB 30 200 nJ • CB 15 (Cleaved-ANTARES) 50 nJ
Procedure: • Compute the velocity of light for all LEDs ID Low statistics No phe level analysis 1/v as reference parameter: • ¿Why do we have lack of statistics for UV runs?
Procedure: • Take a look over charge distributions: • Summary blue LEDs classified by energy:
DATA ANALYSIS • Charge -Time distributions for signal hits OM by OM photoelectron region is considered: PHOTOELECTRON REGION RUN: 33983 [90, 220] ≡ [F9, F17]
DEAD CHANNEL DEAD CHANNEL
DATA ANALYSIS • Charge -Time distributions for signal hits OM by OM photoelectron region is considered: PHOTOELECTRON REGION RUN: 36035 [60, 220] ≡ [F7, F17]
To other golden runs we have similar distributions where we can see the hits and charge losses: • http://ific.uv.es/~yepes/optical_properties/distributions/ • Do we need to consider a new cleaning based on the charge losses for the OMs? • A new preliminary visual inspection is required?
DATA ANALYSIS • The summary of the last group meeting Tmax influence over values for L parameter (10, 20, 30, 40, 50, 60, 70, 80, 90, 100, 200, 300, 400, 500, 600, 1000) ~ Inputs MC (18 runs) • Real data: each point corresponds to the mean value of the distribution of 18 runs in each time window. Monte Carlo Real data TO CHECK…