Download
1 / 17
170 likes | 290 Views
Detection and Classification of Buried Radioactive Metal Objects Using Wideband EMI Data. Anish Turlapaty , Jenny Du, and Nicolas Younan Department of Electrical and Computer Engineering Mississippi State University IGARSS 2011 Vancouver, Canada. Outline.

E N D
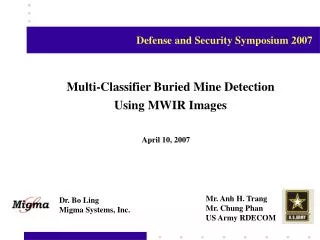
Detection and Classification of Buried Radioactive Metal Objects Using Wideband EMI Data AnishTurlapaty, Jenny Du, and Nicolas Younan Department of Electrical and Computer Engineering Mississippi State University IGARSS 2011 Vancouver, Canada
Outline • Overview and Background • Detection Methods • Methodology • Feature Extraction • Multistage Learning • Validation • Performance • Summary
Background • Depleted Uranium (DU), in general, is considered both a toxic and radioactive hazard - Effectively detecting DU is of great importance • Although DU and other radioactive materials have different characteristics, the detection of DU from other metals is challenging due to spectrum similarities • In practice, the situation can be much more complicated due to the presence of background clutters, especially when the DU is buried • Even more challenging to accomplish detection in an automated fashion
Utilizing EMI data, a pattern recognition approach based on a decision tree for DU detection is developed Detection Methods • Common techniques applicable to landmine detection • Use a library of signatures • Bayesian approach • Bivariate Gaussian model • However the problem of variable orientation of the target object is not solved
Methodology Field data Feature Vectors Multi-stage Learning Feature Extraction Validation Signature Extraction Classification Map Best Fit Target Signature
Field Data Description Field Data (raw test data) Collected from a rectangular grid of size 60m x 16m EMIR is collected for 7 frequencies (widely separated) 330 990 3030 6030 13050 21300 43080 Classes 1- DU at surface, 2- DU at 30cm, 3- DU at 60cm, 4- clutter
Feature Selection ω3 ω4 Relevant features: Four spectral values of quadratic component centered around the peak value in the region of interest are ω5 Motivation Quadratic component of EMI response of 1 inch DU rods has a peak at around 3.5kHz The relation between the peak value and the values from its neighboring bands can be very useful for characterizing DU metal of the same radii. ω6 ω2 ω7 ω1
Multi-stage Classification Feature Vectors Central features are the spectral values at Central Features > thr1 YES NO Threshold thr1 is determined from the histogram of the corresponding feature Central Features > other Features Background YES NO Other Metals Feature Subset One-Class SVM Training PDF Estimation Map Generation Clustering Class Map PDF Visualization Class Separation
PDF Estimation • The PDF has two distinct Gaussian peaks • The Gaussian peaks correspond to the centers of two Gaussian distributions,thus two clusters
Clustering • Individual feature vectors are classified to one of these two clusters based on their distance to the two centers • A threshold value is used to reject vectors that do not belong to either cluster
Validation EMI Response is measured for seven metal cylindrical rods of 4inch length and 1inch diameter at 29 frequencies from 90 Hz to 90KHz. Target response is basically quadratic response of objects at selected locations from classification map Laboratory Measurements with GEM-3 sensor Linear Model Target Response Reference Signatures Best fit
Validation Contd. • The Quadratic component of the EMI Response of the buried target should have high correlation with the EMI response of the same object measured in the laboratory. • Depth vs. Magnitude of EMI Response for compact objects • The magnitude of H field inversely depends on Nth power of the distance • Thus objects of class 1 have higher magnitude as they are closer to surface • Class 2 objects are much deeper thus relatively weaker signal strength Corresponds to Quadrature response of DU objects at the surface (Class 1)
Mean EMI Response Corresponds to DU objects at 30cm depth Supported by the reduced magnitude of the EMI response Non-DU metal object with different EMI signature (clutter)
Performance DU Objects Clutter Soil Background • Multistage approach with SVM for DU discrimination and depth separation • Confusion Matrix Average accuracy 95 %
Summary • Unsupervised classification of different objects at different depths using a multistage learning method with OCSVMs is shown to be quite successful • This method is validated by comparing the target signatures from each class with laboratory measurements • Extension of this work is testing the detection and/or discrimination algorithm in the presence of substantial clutter and variable size DU objects