Download
1 / 27
790 likes | 2.06k Views
1.3 Psychology Statistics. AP Psychology Mr. Loomis. Descriptive Statistics. Definition… Describe a set of data Measures of Central Tendency Measures of Variation Skewed Distributions. Measures of Central Tendency. Mean Average score

E N D
1.3 Psychology Statistics AP Psychology Mr. Loomis
Descriptive Statistics • Definition… • Describe a set of data • Measures of Central Tendency • Measures of Variation • Skewed Distributions
Measures of Central Tendency • Mean • Average score • Extreme scores have a greater impact on the mean than on the mode or median • Median • Score that divides a frequency distribution exactly in half, so that the same number of scores lie on each side (middle) • Mode • Most frequently occurring score (bimodal)
Measures of Variation • Definition • Measure of variation in a single score that presents info about the spread of scores in a variation • Range – highest minus the lowest • Standard Deviation – a standard measurement of how much the scores in a distribution deviate from the mean • The most widely used measure of variation • Z-score (standard score) – the distance of a score from the mean in units of standard deviation
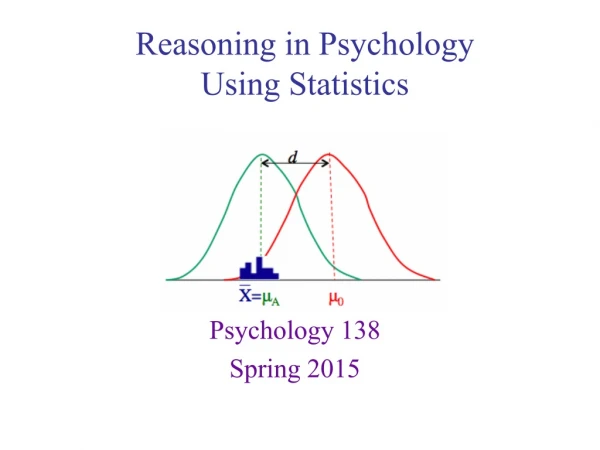
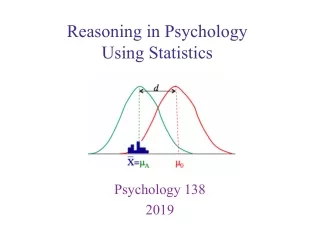
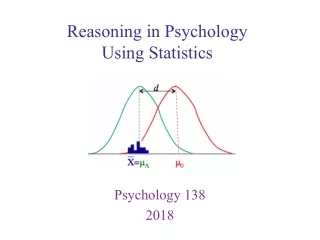
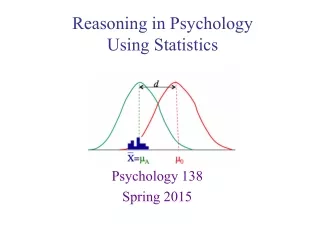
Normal Distribution • Form a bell-shaped or symmetrical curve
Normal Distribution • The percentage of scores that fall at or above the mean is 50…the percentage that fall below (or at) the mean is also 50
Normal Distribution • On-third of the scores fall one standard deviation below the mean and on-third fall one standard deviation above the mean • Example…Wechsler IQ Tests • Mean = 100 / Standard Deviation = 15 • One-third score 85-100 • Another third score 100-115
68-95-99.7 Rule • 68% of scores fall within one SD • 95% of scores fall within two SD • 99.7% of scores fall within three SD
Percentile • Distance of a score from “0” • Examples • 90th percentile – score better than 90% • 38th percentile – score better than 38%
Skewed Distributions • Positively Skewed Distributions • Contain a preponderance of scores on the low end of the scale (looks like “P” lying on back • Mean is higher than the median • Thus the median is a better representation of central tendency in positively skewed distributions
Skewed Distributions • Negatively Skewed Distributions • Contain a preponderance of scores on the high end of the scale • Mean is lower than median • Thus the median is a better representation of central tendency in a negatively skewed distribution
Inferential Statistics • Key points… • Most experiments are conducted with a small sample of subjects • Psychologists want to generalize the results from their small sample to a larger population • IS are used to determine how likely it is that a study’s outcome is due to chance and whether the outcome can be legitimately generalized to the larger population from the sample selected
The P-Value • Probability of concluding that a difference exists when in fact this difference does not exist • A statistically significant difference is a difference not likely due to chance (shows up 5% of the time or less) • Smaller the p-value, the more significant the results • Can never be “0” (researchers can never be 100% certain the results did not occur by chance)