Download
1 / 18
180 likes | 275 Views
Explore the identification and ranking of critical contingencies in power systems through simulations and domain analysis, focusing on series capacitors, load models, and critical clearing time evaluation. Study the effects of N-1 contingencies and series capacitor bypassing on system stability. Compare different load models to optimize system performance.

E N D
Contingency Ranking byTime Domain Simulations ECE 422/522 Russell Patterson Micah Till Terry Jones
Project Goals • Identify top five critical contingencies in Zones 2-A and 2-B
Project Goals • Rank the top five contingencies by the stability criterion. • Rank the top five contingencies by their Critical Clearing Time and compare the ranking with that based on values of • Determine the effect of varying load models
Task 1: Rank N-1 Contingencies • A study was created in TSAT using the Case Wizard • Contingencies were ranked by the stability criterion: (1) • The results of this analysis are presented below
Task 1: Rank N-1 Contingencies almost 4GW • Bus 83 is the major bottleneck for power flow between Zones 1-A and 2-A • As seen, all of the buses in Table 2 are electrically close to bus 83 • Many of these branches are negative reactance, which means they represent series capacitors • In reality, some of the series capacitors would be bypassed during faults
Briefly - Series Capacitors • Used to increase the MW transfer capability of the path (XL – XC) • 60% series compensation means XC = 60% of XL • Too much compensation can lead to problems like overvoltage and subsynchronous resonance (SSR)
Briefly - Series Capacitors • subsynchronous resonance (SSR) can result if too much series compensation is applied • More XC means higher fR • SSR usually in the range of 10 to 50Hz rad/s Hz IEEE definition: “Subsynchronous resonance (SSR) is an electric power condition where the electric network exchanges energy with a turbine/generator at one or more of the natural frequencies of the combined system below the synchronous frequency of the system.” Reference: EPRI Power Systems Dynamics Tutorial
Briefly - Series Capacitors • Series capacitors are bypassed when current through produces voltage across of 150-300% • Initially bypassed by arrester (non-linear) • Hard bypassed prior to exceeding MOV energy capability V I
Briefly - Series Capacitors • Series capacitors directly in faulted line will be hard bypassed • Series capacitors farther away will likely just be partially bypassed as their voltage peaks • Those not hard bypassed will be quickly re-inserted after fault is cleared • Hard bypassed will take as long as 5-cycles to reinsert (if at all)
Briefly - Series Capacitors Series compensation at Dafang, China Ref: “Series Capacitor By-pass Switch – ABB”
Briefly - Series Capacitors • TSAT – create user defined model which can be accessed in dynamic editor as SERUDM (TSAT has a test case of a thyristor-controlled series compensator (TCSC) model) • PSS/E has model called SCGAP2 • PSLF has model called SCGAP How can series capacitor bypassing be handled in transient stability analysis?
Task 1: Rank N-1 Contingencies • To test the assumption that properly modeled series capacitor bypassing would change the results, a 3-phase fault was place close-in to bus 83 and the rotor angle of generator 112 was recorded. • This was repeated with the capacitive branches shorted out (bypassed). • Note that while the results will eliminate the effects of series capacitors, they still will not accurately reflect system response
Task 1: Rank N-1 Contingencies • Initial run in black, run with series capacitors bypassed in red • Note that initial case loses stability shortly after fault inception
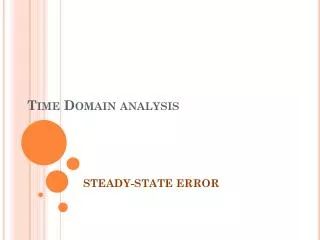
Task 2: Critical Clearing Time • TSAT was able to identify the CCT by gradually increasing the clearing time until the stability criterion became negative. • The closer the faulted line is to generator 112, the smaller the CCT
Task 2: Critical Clearing Time • Cannot transmit power through zero voltage bus
Task 3: Load Model Comparison • The load models were varied as shown: • Note that conversion to a constant impedance load was required below a certain threshold for TSAT to calculate solutions for all contingencies • Results for LM2, LM3, and LM4 were compared to the CCT values from LM1
Task 3: Load Model Comparison • Constant impedance (LM2) performs better than the mixed model (LM1) • Constant current (LM3) and power (LM4) cannot solve unless certain buses are converted back to constant impedance (LM2) • Even after this, LM3 and LM4 underperform LM1
Task 3: Load Model Comparison Thank You!