Download
1 / 19
190 likes | 324 Views
Characterizing the Variability of the Eastern North Pacific in Time and Space. Robin Tokmakian Naval Postgraduate School Monterey California rtt@nps.edu. Outline Introduction & Background to region Information on wavelet methodology for decomposing altimeter surface signal

E N D
Characterizing the Variability of the Eastern North Pacific in Time and Space Robin Tokmakian Naval Postgraduate School Monterey California rtt@nps.edu • Outline • Introduction & Background to region • Information on wavelet methodology for decomposing altimeter surface signal • Results of analysis & connection to large scale & long period climate signals
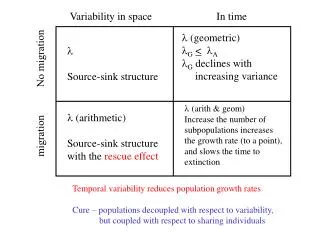
Pacific North American Index National Weather Service - Climate Prediction Center Area of Interest
From US National Weather Service Climate Prediction Center: Pacific-North American Index Definition “The positive phase is associated with an enhanced East Asian jet stream and with an eastward shift in the jet exit region toward the western United States. The negative phase is associated with a westward retraction of that jet stream toward eastern Asia, blocking activity over the high latitudes of the North pacific, and a strong split-flow configuration over the central North Pacific. The positive phase of the PNA pattern is associated with above-average temperatures over western Canada and the extreme western United States, and below-average temperatures across the south-central and southeastern U.S. … The positive phase of the PNA pattern tendsto be associated with Pacific warm episodes (El Niño), and the negative phase tends to be associated with Pacific cold episodes (La Niña).”
RMS Variability of SSH 1993-2004 cm AVISO data set [Ducet, et al., 2000]. Combines data from several altimeters, TOPEX/Poseidon, Jason-1, ERS-1/2, Envisat, and GFO.
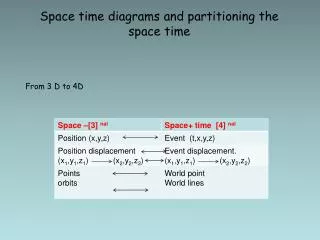
Wavelet methodology Torrence & Compo 1998 and temporal sampling Given a time series: Then the wavelet is defined as: is the “wavelet function - in this case a Morlet* function Where * defines the complex conjugate and We construct the wavelet pattern by varying the wavelet scale, s, and translating it along the time index n is complex and the transform can reveal both amplitude | | phase information The wavelet power spectrum is defined as squared and for comparisons, different wavelet spectra are normalized by their variance. *A Morlet function is a plane wave modulated by a Gaussian function
months year year Wavelet Example & Decomposition 5 year average band 10 year average band 15 year average band
YEAR ALPI PNA ENSO MEI Average Spectral Energy & Temporal Evolution Average from 33°N
Spectral Energy Evolution at 4 locations 238°E (122°W) 37°N 210°E (150°W) 50°N 232°E (128°W) 37°N 205°E (155°W) 25°N
Temporal variance of SSH and Wind Stress @ 50°N, 210°E (150°W)
YEAR ALPI PNA ENSO MEI Spectral Energy in high frequency band at 2 latitudes
Meridional Velocity across 5 latitudes, in-shore and off-shore
Spectral energy @ 37°N Spectral energy @ 47°N Zonal Energy in 2-3 year band @37°N, @47°N
POP Model: Color Altimeter: Contours Connection to 3-9 month band energy spectra in a 0.2° resolution ocean GCM
POP Model: Color Altimeter: Contours Connection to 2-3 year band energy spectra in a 0.2° resolution ocean GCM
Signif. > 0.5 Signif. > 0.73 Signif. > 0.95 Correlations between SSH and Reynolds SST monthly maps
Conclusions • Distinct areas of variability • coastal • off-shore • Sub-tropical gyre • Alaska gyre • Primarily wind-driven, but differences in variability @ short periods. • SST strongly correlated with low frequency SSH patterns. • Off-shore SSH spectra @ high frequency most related to PNA atmospheric index.