Download
1 / 21
210 likes | 332 Views
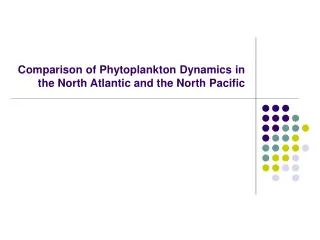
Comparison of Phytoplankton Dynamics in the North Atlantic and the North Pacific. North Pacific. North Atlantic. Temporal standard deviation of chlorophyll (mg m -3 ). Temporal standard deviation of chlorophyll (mg m -3 ). Temporal standard deviation of carbon biomass (mg m -3 ).

E N D
Comparison of Phytoplankton Dynamics in the North Atlantic and the North Pacific
North Pacific North Atlantic Temporal standard deviation of chlorophyll (mg m-3) Temporal standard deviation of chlorophyll (mg m-3) Temporal standard deviation of carbon biomass (mg m-3) Temporal standard deviation of carbon biomass (mg m-3)
North Atlantic Box 19ºW - 21ºW, 49.5ºN - 50.5ºN North Pacific Box 144ºW - 146ºW, 49.5ºN - 50.5ºN Chlorophyll Phytoplankton Carbon from Particulate Backscatter (Behrenfeld et al., 2005)
North Atlantic Box 19ºW - 21ºW, 49.5ºN - 50.5ºN North Pacific Box 144ºW - 146ºW, 49.5ºN - 50.5ºN Chl:C Ratio
Full Time Series Pacific: 160ºW-140ºW Atlantic: 20ºW-40ºW Chlorophyll Phytoplankton Carbon from Particulate Backscatter (Behrenfeld et al., 2005)
Full Time Series Pacific: 160ºW-140ºW Atlantic: 20ºW-40ºW • Why are summer Chl:C ratios lower in the Pacific than the Atlantic? • More light in the Pacific? • Stronger nutrient stress in the Pacific? Chl:C Ratio
Chlorophyll:Carbon Ratio Observed Chl:C Growth Irradiance Ig Pacific Pacific Atlantic Atlantic Calc. Chl:C = f(Ig) Atlantic Geider Model: • max = b / (1 + b • a • I / (2 • Pcmax)) + a • b = 0.038 mg Chl / mg C, a = 0.002 mg Chl / mg C • a = 3.0E-5 gChl-1 gC W-1 m2 s-1, Pcmax = 3.0E-5 s-1 • I = growth irradiance (W m-2) Pacific
Atlantic calculated observed Pacific calculated observed Chlorophyll:Carbon Ratio
Atlantic Pacific Chlorophyll:Carbon Ratio Atlantic No growth limitation calculated observed Strong growth limitation Pacific Nutrient (and Temperature) Limitation Index: • f(N,T) = obs / max • obs = observed Chl:C • max = calc. max. Chl:C from Geider, assuming no nutrient limitation calculated observed
Atlantic Pacific Chlorophyll:Carbon Ratio Atlantic No growth limitation calculated observed Strong growth limitation Pacific Pacific calculated Atlantic observed Fan et al., subm.
Opal Flux (Wong & Matear, 1999) Ocean Station P, Sediment Trap Data
Particulate Backscatter (Stramski et al., 2004) “More recently, it was suggested that in typical non-bloom open ocean waters, phytoplankton or all the microorganisms account for a relatively small fraction of particulate backscattering, and that most of the backscattering may be due to non-living particles, mainly from the submicron size range (Morel & Ahn, 1991; Stramski & Kiefer, 1991). The potential role of small-sized organic detritus as a major source of backscattering was emphasized but the significance of minerals was not excluded (see also Stramski, Bricaud, & Morel, 2001). (…) The optical impact of coccolithophorid phytoplankton (coccolithophores) can be, however, very important (Balch, Kilpatrick, Holligan, Harbour, & Fernandez, 1996). These phytoplankton species produce calcite scales called coccoliths that are characterized by a high refractive index. It was estimated that even outside the coccolithophore bloom, 5–30% of the total backscattering could be associated with coccoliths (calcite plates detached from cells) and plated cells.”
Full Time Series Averaged: 160ºW-140ºW Averaged: 20ºW-40ºW Maximum Chl:C Ratio Nutrient Limitation Factor