Download
1 / 3
30 likes | 141 Views
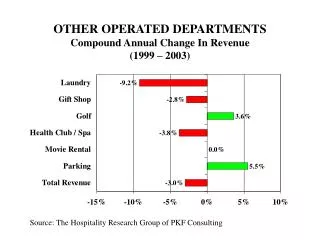
Explore the compound annual change in revenue and percent of total revenue for other operated departments from 1999 to 2003, based on data collected by The Hospitality Research Group of PKF Consulting. Examine the revenue trends in 2003 dollars per available room and as a percentage of total revenue, highlighting insights for strategic analysis and decision-making.

E N D
OTHER OPERATED DEPARTMENTSCompound Annual Change In Revenue(1999 – 2003) Source: The Hospitality Research Group of PKF Consulting
OTHER OPERATED DEPARTMENTS*2003 Dollars Per Available Room Note: * Data for each revenue source derived from a unique sample. Source: The Hospitality Research Group of PKF Consulting
OTHER OPERATED DEPARTMENTS*2003 Percent Of Total Revenue Note: * Data for each revenue source derived from a unique sample. Source: The Hospitality Research Group of PKF Consulting