Download
1 / 49
510 likes | 565 Views
Explore the development process, economic status, and competitiveness of East Asian Economies. Learn about growth trends, challenges, and international economic relations in the region.

E N D
East Asian Economy <Lecture Note 1 > 2013.09.05 East Asian Economy: Introduction (East Asian Economy in the World) * Some parts of this note are summary of the references for teaching purpose only. Semester: Fall 2013 Time: Thursday 2-5 pm Room: 217 Professor: Yoo Soo Hong Office Hour: By Appointment Mobile: 010-4001-8060 E-mail: yshong123@gmail.com Home P.: http://yoosoohong.weebly.com 1 1
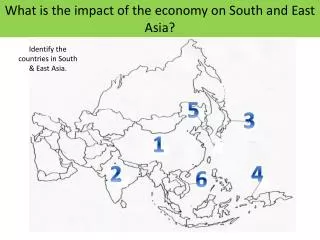
Geography • Large degree of variance between countries
From Ashes to Riches Waves of Pacific Asian Development • First Wave, 1950s (Japan). • Second Wave, 1960s (The Four Dragons). • Third Wave, 1970s (Malaysia, Thailand, China and Indonesia). • Fourth Wave, 1980s (The Philippines and Vietnam). • Fifth Wave, 1990s (Growth and recession). 1940 WWII 1950 Korean War Japan Great Leap Forward 1960 Four Dragons Vietnam War Cultural Rev. 1970 China, Malay., Thai., Indo. 1980 Philippines, Vietnam 1990 AFTA Asian Crisis 2000 China joins WTO
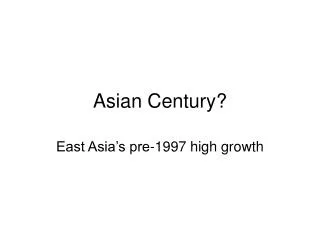
The Asian Century? - A major trend of globalization today is the concentration of global producion networks, trade, technology transfer, and financial flows into three key geographic regions: North America, the European Union, and East Asia. - Especially, Northeast Asia - China, Korea, and Japan – has become the global center of manufactured goods, producing one-fifth of global production, and leader in information technology.
Introduction • Purpose • To learn the development process and factors, current and future economic status and characteristics, and international competitiveness and soft power of (East) Asian Economies • Main Contents • Development models, government strategies and policies, and business activities in most countries • Major international economic relations in Asia such as trade, FDI, economic integration and cooperation • National competitiveness • Future of the Asian Economy
Recent Performance and Challenges • Economic Growth • The recent growth performance of developing economies in East Asia has been slowed down due to the world economic crisis. However, there are wide differences among economies. • Inflation • East Asian economies have maintained lower and stable consumer price, but recently, some economies are watching inflationary pressure. • Current Account • East Asian economies have achieved positive and increasing account balance. However, finally East Asia also is exposed to the challenge and negative effect of European long-term recession and trade is slowed down. The prospect on ending of the monetary expansion policy US s negatively affevcting several East Asian Economies.
East Asia Economic Growth (%) Source: World Bank data and staff estimates. The World Factbook. Asian Development Outlook 2010. Korea Exim Bank, 2011 World Country Handbook. 9
Selected Economic Indicators, Developing Asia, 2009 Source: International Monetary Fund, World Economic Outlook Database, April 2010. East Asia is the sum of Developing East Asia and the Newly Industrialized Economies
Northeast, Southeast, and South Asia have been Catching Up to Developed Nations Average annual growth rates of GDP per capita, 1960–2006 Source: World Development Report 2009.
Growth in Northeast Asia and Southeast Asia • Trends in Northeast Asia • Overall, economies in the region show strong recovery from the earlier recession. China has recorded highest growth rates whereas the performance of Korea and Taiwan have been less impressive. Japan seemed recovering from the ‘lost decade’, but it is in trouble again. Korea has lost growth momentum. • Trends in Southeast Asia • In the 1970s, overall performance in growth in Southeast Asia had been lower than Northeast Asia. However, recently Southeast Asian countries have shown robust growth, including Lao PDR, Cambodia, and Myanmar.
Poverty Reduction Source: ADB
Northeast Asia, GDP Growth, % Northeast Asia China Hong Kong, China Korea Mongolia Taipei, China 0 2 4 6 8 10 2005 2002 2003 2004 Sources: Asian Development Outlook database; staff estimates
Southeast Asia, GDP Growth, % Southeast Asia Cambodia Indonesia Lao People's Dem. Rep. Malaysia Philippines Singapore Thailand Viet Nam 0 2 4 6 8 10 2002 2003 2004 2005 Sources: Asian Development Outlook database; staff estimates
Developing Asia, GDP Growth, % Sources: Asian Development Outlook database; staff estimates
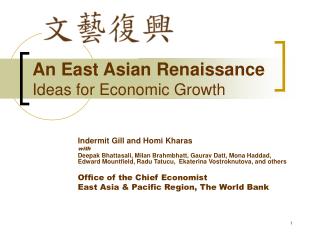
A Densification in Regional Trade 18 Source: The World Bank, The East Asia Renaissance, 2007
Changes in Shares of Global MVA (% points) 8 7 6 5 4 3 2 1 0 -1 -2 LAC E Asia S Asia MENA SSA 1980-1990 1990-2000 Source:UNIDO Database.
Growth Rate of Merchandise Trade (% per year) Source: ADB. Asian Development Outlook 2010.
Exports in Asia, 2008 Source: World Trade Organization Database.
Changes in the East Asian Economy • NewEconomic Strength of East Asia • In 1997-98, a financial crisis brought in four economies in East Asia. Many predicted that the structural weakness that the crisis laid bare-corruption, cronyism, nepotism-would condemn the region to stagnation as had happened in Latin America after a debt crisis in the mid-1980s. The recovery of the emerging economies of the region since 1998 has been remarkable. - Exports have increased to one-fifth of the world’s total, or a value of more than US$2 trillion per year, making emerging East Asia one of the most open trading regions in the world. The region is the largest destination for foreign direct investment (FDI) and has US$1.6 trillion worth of foreign exchange reserves. Its capital markets have grown, and its domestic financial sector assets amount to US$9.6 trillion.
The pace of change in trade and finance, ideas, and technology, urban development, household finance, and the demands on the public sector is breathtaking. If current growth trends prevail, East Asia will be as large in terms of the world economy (40percent) by 2025. • Common economic characteristics cannot be the whole explanation since the diversity among these countries is enormous. Emerging East Asia includes China,with1.3 billion people, and Mongolia with 2.5million. Per capita incomes range from US $400 in the Lao People’s Democratic Republic to US $24,000 in Singapore. Hong Kong (China) is perhaps the most laissez-faire economy in the word, while Vietnam is one of the few remaining socialist economies. Is there something special about East Asia that makes these economies grow?
A Changing Economic Landscape • It is clear that the economic landscape in East Asia is quite different in 2006 than it was in 1990. The region is much richer than it was. The size of the regional market is larger. Individuals are also richer, and the demand for consumer durable is growing. The economic center of gravity-product, trade, and finance-has shifted toward China and Northeast Asia. Regionalism within East Asia has risen sharply in the guise of formal economic trade agreements between two or more countries. The 24 new agreements have been concluded, and 34 more are under negotiation. - East Asian countries that have successfully integrated into the global economy are now integrating regionally. East Asian countries appear to have learned the lessons of the economic crisis (financial crisis 1997-98) and have fortified themselves for continued international integration. Collectively, East Asia have sought regional integration to stay globally competitive.
A Richer Region With a Growing Middle Class • In 1990, developing East Asia had a GDP of US $1.2 trillion. Today, the total is US $4 trillion. Because of economic growth, East Asia has become more middle income. The more than 95 percent of East Asia will reside in a middle - income country. East Asia ‘s economic future depends on the prospects and performance of middle – income countries. • Middle – income countries have to do something different. They have grown less rapidly than either rich or poor countries, and this accounts for the lack of economic convergence in the twentieth century world. This is the challenge that confronts East Asian countries today, especially those in Southeast Asia. There is reason for optimism. The newly industrializing economies in East Asia successfully made this transition from middle income to rich, showing that such a transition is possible under the proper circumstances and the correct policies. And, within Asia, the newly industrializing economies remain successful manufacturers, even in quite mature industries, while China and India show that success in the knowledge economy is not reserved only for rich countries.
China Is Driving Regionalization and Regionalism • China is the biggest development story in the world today and a major economic presence in the region, representing one-half of developing East Asia’s GDP and one-third of its exports. Especially, since its accession to the World Trade Organization in November 2001, China has offered major opportunities as a rapidly growing market for Asian exports. It is also a major competitor. Policy makers throughout the region are rethinking national strategies as they adjust to China’s economic growth. - Intraregional trade in East Asia has been market driven and, hence, best described not as the product of regionalism, but of regionalization, the natural by-product of the fact that the East Asian economies are among the most rapidly growing and most open economies in the world. East Asian countries have been the strongest proponents of multilateral and unilateral trade liberalization, and it is only recently that regional trade agreements have proliferated. It appears that this has been closely linked to the changing pattern of trade and investment in the region and, hence, to real economic forces, not any political considerations favoring regional approaches, nor a backlash against globalization following the Asian crisis.
The economic landscape of East Asia has changed profoundly since the early 1990s. The region is large in size, and income levels have risen across the board. It is more open than ever, and intraregional trade is expanding rapidly. At the same time, East Asia’s share of exports to the rest of the world has also risen, albeit not as sharply. East Asia integrated globally first and is now integrating regionally. China is at the center of this development, but the institutional framework for regional cooperation is relatively immature, and the ad hoc arrangements may have costly side effects. • A Changing Intellectual Landscape • In the real world of policy making in East Asia, there is a major debate on regional integration and cooperation that revolves around trade liberalization.
Growth occurs as a result of the exploitation of scale economies through specialization and innovation and is reflected in international integration via the trade in goods, money, and ideas. This integration triggers spatial and social changes that have an impact on domestic integration and the process of urbanization and income distribution. If they are well managed, these social and spatial trends may, in turn, feed back into more scale economies through agglomeration of production and incentives for more rapid skill formation. If managed badly, spatial and social problems may lead to the waste of the economic benefits of scale economies through congestion, pollution, social discord, and corruption, sharply reducing the resources available for investment and growth. • Scale economies do seem to play an important role in East Asia. One source of scale economies is in product markets. There can be efficiency gains from larger production volumes (plant level scale economies). More scale economies result from the ability of large producers to reduce fixed costs of branding, marketing, and product development per unit of production (firm level scale economies).
New Economic Growth - The new growth theory starts with the recognition that, in standard neoclassical economics, there is little room for the entrepreneur. Entrepreneurs develop new ideas, technologies, markets, and business processes. In doing so, they expect to be rewarded. But rewards to entrepreneurs are ruled out in a context of perfect competition with constant returns to scale, so there are no incentives for entrepreneurial activity. To escape this awkward result, neoclassical models have to assume an exogenous growth rate of technology. This means that such models have nothing to say about the long-run growth of frontier economies and emphasize new capital accumulation exclusively so that developing countries may reach high-income status. - New growth theory tries to model how innovations actually happen in a real economy by allowing for some economic rewards that go to entrepreneurs. It attempts to explain the observation that around 60 percent of export growth seems to take place through new product varieties, rather than through the exportation of greater volumes of the same goods.
Trade and Technology - Dramatic changes are taking place in the composition of East Asian trade, and, at the same time, the value of trade is expanding. Low-skill, labor-intensive products are becoming less important, even for China, and now account for only 15 percent of total exports. Instead, exports of higher-skill and higher technology products, are growing most rapidly. This trade pattern in machinery may best be explained by two related technological developments that have profoundly affected the way in which goods are produced and sold worldwide: scale economies and vertical specialization. - Scale economies in machinery exist at the plant level (determined by engineering), the firm level (for example, the availability of internal research and development [R&D] facilities), and the economy-wide level (agglomeration economies in cities). Industrial engineers have concluded that scale economies exist in products such as scientific instruments, electrical machinery, non electrical machinery, iron and steel, and pharmaceuticals. These are precisely the products in which the share of East Asian exports has increased. On the other hand, products such as wood, footwear, leather, apparel, and textiles show no tendency toward scale economies; these industries have seen their export shares fall.
- Vertical specialization describes the potential for breaking down production into different components that may later be combined into final goods. If each component is produced in a specialized plant located where the cost is the lowest and the variety and innovation are the highest, then the final good may be produced at a lower cost and higher quality. If vertical specialization leads to the production of components outside the firm, this is called outsourcing. • If the production takes place in another country, it is called offshoring. To be cost effective, offshoring requires low transport costs in terms of logistics and trade tariffs. In addition, a buyer must be assured that the selected component manufacturer is, indeed, the producer at the lowest cost and, so, must incur information and search costs that need to be efficiently covered. Offshoring has also been fostered by changes in business models. To ensure a constant inventory of supplies, vertically integrating firms used to take over factory production lines.
Becoming a Gravitational Centre:Proportions of World Economic Output, 2007 and 2050 (%)
Asia’s Proportion of Global GDP from the Year 1000 to 2013 (Adjusted for Purchasing Power)
Inward FDI Stock as a Percentage of Gross Domestic Product, by Region and Economy (%) Source:UNCTAD, World Investment Report 2010, various years.
World Foreign Direct Investment Outflows (in U.S.$ millions)
Diversity in Political and Economic Development - High correlation (0.90) but causality cannot be argued from this diagram - Only circled economies participate in regional dynamism Sources: Compiled from World Bank, Worldwide Governance Indicators, Sep. 2006; and World Bank, World Development Indicators, 2006. (From Kenichi Ohno.)
East Asia’s Policy Mix Source: Kenichi Ohno
Korea: Per Capita GDP in 1990 USD 90% middle class 80% farmers End of AD
References * Video. “Noodle Road”. ADB. 2012. Asian Development Outlook 2013. ADB. 2012. Key Indicators 2011, 2012. Gill, Indermit and Kharas, Homi. 2006. An East Asian Renaissance: Ideas for Economic Growth. Washington, D.C.:World Bank. Ohno, Kenichi. 2007. “The East Asian Growth and Political Development”. GRIPS. (PPT)