Download
1 / 21
210 likes | 347 Views
Fixed Area Sampling. Avery and Burkhart, Chapter 10. Source: J. Hollenbeck. FOR 220 Aerial Photo Interpretation and Forest Measurements. Fixed Area Plot Sampling. Plot Cruising. FOR 220 Aerial Photo Interpretation and Forest Measurements. Fixed Area Plot Sampling. Plot Cruising.

E N D
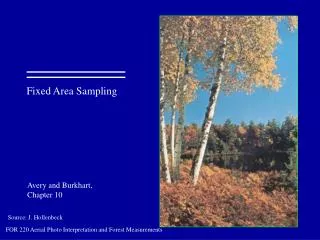
Fixed Area Sampling Avery and Burkhart, Chapter 10 Source: J. Hollenbeck FOR 220 Aerial Photo Interpretation and Forest Measurements
Fixed Area Plot Sampling Plot Cruising FOR 220 Aerial Photo Interpretation and Forest Measurements
Fixed Area Plot Sampling Plot Cruising Nominal cruise intensity How much of the land was sampled? Examples: 1/10 acre plot on a 2 x 5 chain spacing: (remember 10sq. ch. = 1 ac.) FOR 220 Aerial Photo Interpretation and Forest Measurements
Fixed Area Plot Sampling Plot Cruising • Some advantages of plot cruising: • 1. Suitable for one-person cruising. • 2. Cruisers do not have to tally trees while following a compass line. • Cruisers pause at plot centers, allowing more time to check • measurements. • 4. Tree tally is separated by plots: can separate the plots into sets to calculate volumes for different timber types, etc. FOR 220 Aerial Photo Interpretation and Forest Measurements
Fixed Area Plot Sampling - Different plots for different purposes Regeneration Plots Purposes: To evaluate regeneration status To demonstrate compliance with laws To determine effectiveness of regeneration treatments To identify additional treatments needed To collect data to predict growth and yield • Plot-count method (number of trees per acre) • Stocked-quadrat method (proportion of land utilized) • Staked-point method (like permanent plots) FOR 220 Aerial Photo Interpretation and Forest Measurements
Fixed Area Plot Sampling Nested Circular Plots Smaller Trees Measured on Smaller Plots 1/10 acre plot Trees > 5 inch dbh 1/100 acre plot Trees 2 to 5 inch dbh 1/500 acre plot Trees < 2 inch dbh
Fixed Area Plot Sampling Plot Sampling with • Plots and Product Groups • 1/10 acre for sawtimber, poletimber, invasive (≥ 5 in) • 1/100 acre for small trees • 1/500 acre for advance reproduction
Point Sampling Avery and Burkhart (2002) Chapter 11 Source: J. Hollenbeck FOR 220 Aerial Photo Interpretation and Forest Measurements
Point Sampling Point Sampling A method of sampling based on a tree’s size, rather than its frequency of occurrence. Tools: prisms, angle gauge, Relaskop The probability of tallying a tree depends on its cross-sectional area and the sighting angle used. The smaller the sighting angle, the more trees included in the sample. FOR 220 Aerial Photo Interpretation and Forest Measurements
Point Sampling Point Sampling (Overhead view) Each tree has a given plot size in relation to it’s size. How many of these plots does our point fall into? FOR 220 Aerial Photo Interpretation and Forest Measurements
Point Sampling Point Sampling (Side view) Using a prism: ? Offset tree bole in prism does overlap actual tree bole Borderline tree - must measure distance from point center Offset tree bole in prism has no overlap with actual tree bole FOR 220 Aerial Photo Interpretation and Forest Measurements
Point Sampling Comparing Point Sampling and Fixed Area Plot Sampling Fixed plot sampling Point sampling Sampling is based on.. Frequency of occurrence Tree size Varies by tree Same for all trees Expansion factor PPF PPS FOR 220 Aerial Photo Interpretation and Forest Measurements
Point Sampling Important Ideas about Point Sampling 1. Basal Area Factor (BAF) How much BA does each sampled tree represent? 2. Plot Radius Factor How far away can a tree be and still be sampled?
Point Sampling Basal area factor (BAF) Related to the sighting angle size of the prism used in point sampling. Chosen to provide a tally of 5 - 12 trees per point (8-10) Eastern U.S.: 5, 10, 20 Western U.S.: 20, 40, 60 FOR 220 Aerial Photo Interpretation and Forest Measurements
Point Sampling Calculating basal area from a point cruise: • Example: • BAF 10 prism • 202 trees tallied • 25 points It really is that easy!! FOR 220 Aerial Photo Interpretation and Forest Measurements
Point Sampling Plot radius factor (PRF) The value to use in determining the maximum distance a tree of a given diameter can be from the point to still be tallied. For example, when using a BAF 10 prism, the plot radius factor is 2.75. Which means: For each inch of dbh, a tree can be 2.75 feet from the point to still be included in the point’s tally. Thus a 12 inch tree can be up to 33 feet (12 x 2.75) from the point and still be included in the point’s tally. FOR 220 Aerial Photo Interpretation and Forest Measurements
Point Sampling Nested Plots 10 BAF Prism Sample Trees > 5 inch dbh 1/100 acre plot Trees 2 to 5 inch dbh 1/500 acre plot Trees < 2 inch dbh FOR 220 Aerial Photo Interpretation and Forest Measurements
What about TwoDog? • Plots and TwoDog Product Groups • Prism or 1/10 acre plot for sawtimber, poletimber, and invasive (≥ 5 in) • 1/100 acre for small trees • 1/500 acre for advance reproduction