
Hypothesis Testing
Hypothesis Testing. Goal: Make statement(s) regarding unknown population parameter values based on sample data Elements of a hypothesis test:

Hypothesis Testing
E N D
Presentation Transcript
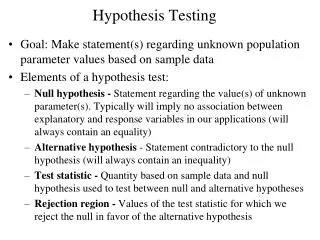
Hypothesis Testing • Goal: Make statement(s) regarding unknown population parameter values based on sample data • Elements of a hypothesis test: • Null hypothesis - Statement regarding the value(s) of unknown parameter(s). Typically will imply no association between explanatory and response variables in our applications (will always contain an equality) • Alternative hypothesis - Statement contradictory to the null hypothesis (will always contain an inequality) • Test statistic - Quantity based on sample data and null hypothesis used to test between null and alternative hypotheses • Rejection region - Values of the test statistic for which we reject the null in favor of the alternative hypothesis
Hypothesis Testing • Goal:Keep a, b reasonably small
Example - Efficacy Test for New drug • Drug company has new drug, wishes to compare it with current standard treatment • Federal regulators tell company that they must demonstrate that new drug is better than current treatment to receive approval • Firm runs clinical trial where some patients receive new drug, and others receive standard treatment • Numeric response of therapeutic effect is obtained (higher scores are better). • Parameter of interest: mNew - mStd
Example - Efficacy Test for New drug • Null hypothesis - New drug is no better than standard trt • Alternative hypothesis - New drug is better than standard trt • Experimental (Sample) data:
Sampling Distribution of Difference in Means • In large samples, the difference in two sample means is approximately normally distributed: • Under the null hypothesis, m1-m2=0 and: • s12 and s22 are unknown and estimated by s12 and s22
Example - Efficacy Test for New drug • Type I error - Concluding that the new drug is better than the standard (HA) when in fact it is no better (H0). Ineffective drug is deemed better. • Traditionally a= P(Type I error) = 0.05 • Type II error - Failing to conclude that the new drug is better (HA) when in fact it is. Effective drug is deemed to be no better. • Traditionally a clinically important difference (D) is assigned and sample sizes chosen so that: b = P(Type II error | m1-m2 = D) .20
Elements of a Hypothesis Test • Test Statistic - Difference between the Sample means, scaled to number of standard deviations (standard errors) from the null difference of 0 for the Population means: • Rejection Region - Set of values of the test statistic that are consistent with HA, such that the probability it falls in this region when H0 is true is a (we will always set a=0.05)
P-value (aka Observed Significance Level) • P-value - Measure of the strength of evidence the sample data provides against the null hypothesis: P(Evidence This strong or stronger against H0 | H0 is true)
Large-Sample Test H0:m1-m2=0 vs H0:m1-m2>0 • H0: m1-m2 = 0 (No difference in population means • HA: m1-m2 > 0 (Population Mean 1 > Pop Mean 2) • Conclusion - Reject H0 if test statistic falls in rejection region, or equivalently the P-value is a
Example - Botox for Cervical Dystonia • Patients - Individuals suffering from cervical dystonia • Response - Tsui score of severity of cervical dystonia (higher scores are more severe) at week 8 of Tx • Research (alternative) hypothesis - Botox A decreases mean Tsui score more than placebo • Groups - Placebo (Group 1) and Botox A (Group 2) • Experimental (Sample) Results: Source: Wissel, et al (2001)
Example - Botox for Cervical Dystonia Test whether Botox A produces lower mean Tsui scores than placebo (a = 0.05) Conclusion: Botox A produces lower mean Tsui scores than placebo (since 2.82 > 1.645 and P-value < 0.05)
2-Sided Tests • Many studies don’t assume a direction wrt the differencem1-m2 • H0: m1-m2 = 0 HA: m1-m2 0 • Test statistic is the same as before • Decision Rule: • Conclude m1-m2 > 0 if zobs za/2 (a=0.05 za/2=1.96) • Conclude m1-m2 < 0 if zobs -za/2 (a=0.05 -za/2= -1.96) • Do not reject m1-m2 = 0 if -za/2 zobs za/2 • P-value: 2P(Z |zobs|)
Power of a Test • Power - Probability a test rejects H0 (depends on m1- m2) • H0 True: Power = P(Type I error) = a • H0 False: Power = 1-P(Type II error) = 1-b • Example: • H0: m1- m2 = 0 HA: m1- m2 > 0 • s12= s22 = 25 n1 = n2 = 25 • Decision Rule: Reject H0 (at a=0.05 significance level) if:
Power of a Test • Now suppose in reality that m1-m2 = 3.0 (HA is true) • Power now refers to the probability we (correctly) reject the null hypothesis. Note that the sampling distribution of the difference in sample means is approximately normal, with mean 3.0 and standard deviation (standard error) 1.414. • Decision Rule (from last slide): Conclude population means differ if the sample mean for group 1 is at least 2.326 higher than the sample mean for group 2 • Power for this case can be computed as:
Power of a Test • All else being equal: • As sample sizes increase, power increases • As population variances decrease, power increases • As the true mean difference increases, power increases
Power of a Test Distribution (H0) Distribution (HA)
Power of a Test • Power Curves for group sample sizes of 25,50,75,100 and varying true values m1-m2 with s1=s2=5. • For given m1-m2 , power increases with sample size • For given sample size, power increases with m1-m2
Sample Size Calculations for Fixed Power • Goal - Choose sample sizes to have a favorable chance of detecting a clinically meaning difference • Step 1 - Define an important difference in means: • Case 1:s approximated from prior experience or pilot study - dfference can be stated in units of the data • Case 2:s unknown - difference must be stated in units of standard deviations of the data • Step 2 - Choose the desired power to detect the the clinically meaningful difference (1-b, typically at least .80). For 2-sided test:
Example - Rosiglitazone for HIV-1 Lipoatrophy • Trts - Rosiglitazone vs Placebo • Response - Change in Limb fat mass • Clinically Meaningful Difference - 0.5 (std dev’s) • Desired Power - 1-b = 0.80 • Significance Level - a = 0.05 Source: Carr, et al (2004)
Confidence Intervals • Normally Distributed data - approximately 95% of individual measurements lie within 2 standard deviations of the mean • Difference between 2 sample means is approximately normally distributed in large samples (regardless of shape of distribution of individual measurements): • Thus, we can expect (with 95% confidence) that our sample mean difference lies within 2 standard errors of the true difference
(1-a)100% Confidence Interval for m1-m2 • Large sample Confidence Interval for m1-m2: • Standard level of confidence is 95% (z.025 = 1.96 2) • (1-a)100% CI’s and 2-sided tests reach the same conclusions regarding whether m1-m2= 0
Example - Viagra for ED • Comparison of Viagra (Group 1) and Placebo (Group 2) for ED • Data pooled from 6 double-blind trials • Subjects - White males • Response - Percent of succesful intercourse attempts in past 4 weeks (Each subject reports his own percentage) 95% CI for m1- m2: Source: Carson, et al (2002)


