Download
1 / 1
10 likes | 138 Views
This paper introduces a synthetic database benchmark designed to assess the performance of grid information servers. With the complexities of managing grid resources, traditional directory services fall short. We develop a benchmark focused on resource information representation and retrieval, applying it across mySQL, Xindice, and MDS2 platforms. We analyze various query types, including scoped, indexed, and join queries, revealing performance insights such as the impact of indexing on query speed. The study also evaluates ease of use through client workload metrics. The benchmark is available at Indiana University's website.

E N D
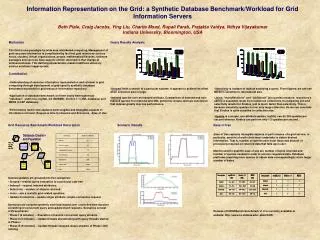
Information Representation on the Grid: a Synthetic Database Benchmark/Workload for Grid Information ServersBeth Plale, Craig Jacobs, Ying Liu, Charlie Moad, Rupali Parab, Prajakta Vaidya, Nithya VijayakumarIndiana University, Bloomington, USA Motivation The Grid is new paradigm for wide area distributed computing. Management of grid resource information is complicated by fact that grid resources such as hosts, clusters, virtual organizations, people, mathematical libraries, software packages and services have aspects of their description that change at millisecond rates. This defining characteristic makes traditional directory service solutions inappropriate. Contribution • Understanding of resource information representation and retrieval in grid computing through development of grid-specific synthetic database benchmark/workload for grid resource information repository. • Application of database benchmark on three vastly heterogeneous “database” platforms: mySQL 4.0 (RDBMS), Xindice 1.1 (XML database) and MDS2 (LDAP database) • Performance metric that captures both tangible and intangible aspects of information retrieval: Response time for Queries and Scenarios, Ease of Use. Query Results Analysis • Scoped limits a search to a particular subtree. It appears to achieve its effect when collection size is large. • Indexed queries over an Indexed attribute. Comparison of Indexed and non-Indexed queries for relational and XML platforms reveals obvious conclusion that indexes greatly improve performance. • Selectivity is number of objects satisfying a query. From figures, we can see MDS2 is sensitive to returned set size. • Joins: “manyRelations” and “jobSubmit” join queries measure repository’s ability to assemble result from numerous collections. In comparing join and selectivity results for Xindice, join is much faster than selectivity. This is because selectivity queries is over very large collection. So we can conclude that Xindice is quite sensitive to collection size. • Update is a simple, one-attribute update. mySQL can do 200 updates per second whereas Xindice can perform only 1.3 updates per second. Grid Resource Benchmark/Workload Description Queries/updates are grouped into five categories: • Scoped – restrict query evaluation to a particular sub-tree • Indexed – request indexed attributes; • Selectivity – number of objects returned; • Joins – ask a realistic grid related question; • Update/Connection – update single attribute; simple connection request Scenarios are scripted synthetic workload issued over controlled time duration consisting of concurrent query and update/insert requests. Scenarios consist of three phases: • Phase I (6 minutes) – Execution of several concurrent query streams. • Phase II (5 minutes) – Update threads started along with query threads started in Phase I. • Phase III (9 minutes) – Update threads stopped. Query streams of Phase I still running. Scenario Results Ease of Use Ease of Use captures intangible aspects of performance of a grid service, in particular, amount of work client must undertake to obtain desired information. That is, number of queries user must issue and amount of processing required on returned data that falls upon user. Metrics used to quantify ease of use are number of bytes returned and number of queries needed in order to retrieve requested data. Database platforms requiring more queries to obtain data correspondingly return larger number of bytes. Release of IURGRbench benchmark v1.0 is currently available at website: http://www.cs.indiana.edu/~plale/RGR/