Current Regional Plans Scenario - Analysis Results
120 likes | 325 Views
Current Regional Plans Scenario - Analysis Results. MTC Planning Committee February 9, 2011. Current Regional Plans. Updates Projections 2009 forecast Starting point for analysis; basis for creation of the Initial Vision Scenario Reflects current planning and assumptions

Current Regional Plans Scenario - Analysis Results
E N D
Presentation Transcript
Current Regional Plans Scenario - Analysis Results MTC Planning Committee February 9, 2011
Current Regional Plans • Updates Projections 2009 forecast • Starting point for analysis; basis for creation of the Initial Vision Scenario • Reflects current planning and assumptions • Not designed to meet the targets • Won’t become the Sustainable Communities Strategy
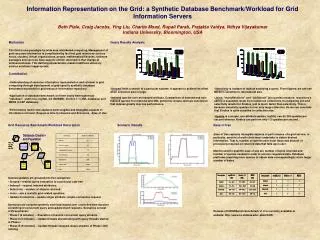
Proj. 2009 w Current Regional Plans • Reviewed Projections 2009 forecast with CMAs & Local Jurisdictions • Reduced Employment Forecast by 205,000 jobs in 2010 and 707,000 jobs in 2035 • Assumed T2035 Transportation Network and Investments
Regional Job Projections Jobs in millions
Current Regional Plans vs. Historical Trends • Assumes higher rates of housing construction than seen historically (24,000 vs 20,000 annually) but still does not meet the housing target. • Still results in insufficient affordable housing (historically about 40% of the region’s need). • Continued commuting growth originating outside the region (jobs exceed employed residents by over 300,000 in 2035).
Revised GHG Emission Reduction Estimates • Targets recommended by MTC and set by ARB • 2020: -7 percent reduction in GHG per capita relative to 2005 • 2035: -15 percent reduction in GHG per capita relative to 2005 • Four key changes: • (1) Higher Bridge tolls were introduced on July 1, 2010 (carpools charged) less automobile travel • (2) Regional HOT network reduced (more financially feasible “backbone”) less automobile travel/more congestion • (3)New model more sensitive to changes in transit supply, roadway supply, density, and congestion less automobile travel • (4) Current Regional Plans (Projections 2011) less travel overall
Revised GHG Emission Reduction Estimates(% per capita - 2005 vs 2035) -2% 0% +2% -7% -10% T-2035 w/Proj 07 T-2035 w/Proj 11 T-2035 w/Proj 11 w/New Model w/HOT Backbone w/Increased tolls T-2035 w/Proj 09 Increase GHG Reductions per capita
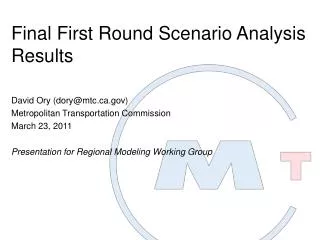
GHG Targets: ARB vs. Current Regional Plans(% per capita reduction compared to 2005)
Conclusions • While we meet the 2020 GHG target, we have a ways to go to meet the 2035 GHG target and other targets • The prolonged Great Recession is having profound impacts on projected job growth • The unconstrained Initial Vision Scenario includes more focused growth in urban areas but still may not get us to the GHG and other targets • Achieving the targets may require greater reliance on non-infrastructure strategies
Key Next Steps Remaining for This Year • Initial Vision Scenario – March 11, 2011 • Define/Evaluate Detailed SCS scenarios/RTP projects – April 2011 to December 2011 • Approve Draft Preferred SCS – December 2011 • Release Draft RHNA Plan – December 2011