Download
1 / 40
400 likes | 505 Views
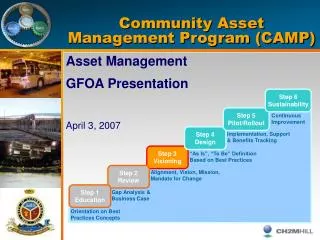
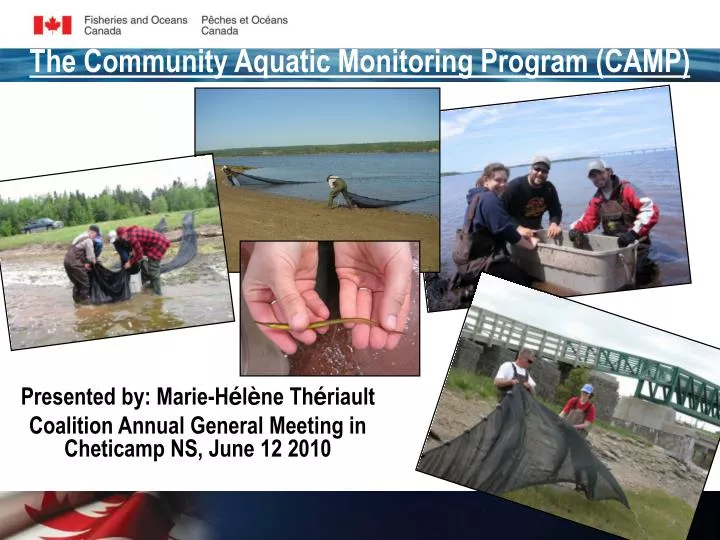
The Community Aquatic Monitoring Program (CAMP). Presented by: Marie-H é l è ne Th é riault Coalition Annual General Meeting in Cheticamp NS, June 12 2010. 2m. 30m. 15m. 2. 225 m. 15 m. shore. What is CAMP?.

E N D
The Community Aquatic Monitoring Program (CAMP) Presented by: Marie-Hélène Thériault Coalition Annual General Meeting in Cheticamp NS, June 12 2010
2m 30m 15m 2 225 m 15 m shore What is CAMP? • CAMP is a monthly beach seine survey collecting fish, shrimp and crab species found in bays and estuaries which was developed by the Department of Fisheries and Oceans (DFO). • It’s a community-led monitoring program which is supported by over 25 Environmental Non-Government Organizations (ENGOs) and by the Coalition covering the entire southern Gulf of St. Lawrence (sGSL).
Key objectives of CAMP Begun in 2003 as a pilot project and in 2004 as a stewardship initiative: 1) Provide an outreach program for DFO to interact with ENGOs to raise awareness of the ecology of estuaries and bays in the sGSL. 2) Collect baseline data on abundance, diversity and coastal community assemblage. 3) Test the hypothesis that healthy areas are characterized by a particular assemblage of animals to possibly develop an index of ecological health of bays and estuaries.
Why we did a review on CAMP? • In 2009, DFO Oceans’ division asked the Science sector to review the last 5 years of data collected through CAMP. • The Oceans’ division also wanted to know if their Regional Vulnerability Atlas could be linked with the CAMP data. • In March 2010, a regional workshop was held at the Gulf Fisheries Centre (GFC) . • 25 persons participated including: DFO, universities and Coalition.
Oceans’ Division Regional Vulnerability Atlas • Oceans’ sector has engaged an ecosystem-based risk analysis decision making process to enable integrated coastal zone management in the sGSL. • This process includes an Ecological Risk assessment of watersheds in which pathways of adverse environmental effects to aquatic ecosystems (ex: Nutrient Regime Alteration) are linked to known pressures (ex: amount of streams within agricultural land) and their potential drivers (ex: Agriculture). • These relationships were used to develop a draft Regional Vulnerability Atlas which maps out drainage basins potentially at risk from particular human activities and their intensity.
95th 5th 25th 50th 75th Percentiles Below Average Average Above Average WATERSHEDS Version 1.1 - September 2009
SEDIMENT REGIME ALTERATION POPULATION DENSITY
Question and Objectives of the Review Question being asked at this review: • Can CAMP be used to infer ecological health of bays and estuaries in the southern Gulf of St. Lawrence sGSL? 5 Objectives for the review: • Review CAMP data from 2004 to 2008 at eleven ‘’core’’ sites and identify the factors in the design that contribute to the variability in community assemblage abundance and diversity. • Review the land use indicators (e.g. pressures) as mapped in the Atlas.
Objectives of Workshop (cont…) 3) Analyse the nekton community variation in relation to the land use indicators from the Atlas (ex: population density, % agricultural land use per watershed, etc…) 4) Identify gaps in CAMP and in the land use assessment and recommend further analyses. 5) Include recommendations on how to better focus the program, increase its efficiency and reduce its costs.
Location of Core sites for CAMP review 11 core sites with a complete set of data sampled from May to Septemberfrom 2004 to 2008 Lameque Shippagan St-LouisdeKent MillRiver Bouctouche TroutRiver Basin Head ScoudoucRiver Mabou Pictou Antigonish
Station descriptor • Within each Site, 6 Stations were sampled. • Some Stations within Sites were chosen to capture a specific problem or concern of point source pollution that either the ENGO or DFO wanted to address (ex: Fish processing plant, sewage treatment plant). • Some other stations were simply chosen because of accessibility or to simply characterize the estuary sampled.
2 - Lyons Brook Pictou Pulp & Paper Mill 3 - Power Plant
Results from the review • Roger Green, expert in environmental monitoring and sampling designs, was hired to present some univariate statistics explaining the variation in the nekton community abundance and richness. • Marie-Hélène Thériault, DFO biologist, presented multivariate statistics on fish and crustacean species data, relating nekton community groupings to land use indicators.
Univariate Results • Sites were different among each other (ex: Shippagan vs. Lameque) • Stations within Sites were different. • Months (May to Sept.) were different from each other = Seasonality • The difference among the Years were not as large as for the other factors. • When we looked at the community assemblage to see which months were different we did not get a lot of differences between May and June and also between August and September. We perhaps don’t need to sample all of them.
If yes: Multivariate Analyses (Done with PRIMER software) Do sites differ in littoral nekton assemblage? Which sites are differentand which are alike? Cluster and SIMPROF analyses Below is a small portion of the dataset we work with in PRIMER
Biotic data average per site MDS-plot
Cluster Analyses – SIMPROF at 68% similarity Pi: 1.28 p = 0.006
What is different about the animal communities in these three clusters? Which species produce these differences?(SIMPER) Cluster 1 = minimal human activity Mabou, Basin Head Cluster 2 = moderate human activity St-Louis de Kent,Bouctouche, Scoudouc,Trout River, Antigonish Cluster 3 = high human activity Lameque, Shippagan, Mill River, Pictou
Which species are contributing most to the discrimination between the three clusters Sites more influenced by humanshave more mummichogs thanmore pristine sites but fewer sand shrimp, grass shrimp and fourspine stickleback Photo by: Bertin Gauvin http://www.dnr.sc.gov/marine/sertc/images/photo Photo by : Christine Ouellette
Why do these species differamong sites? Might the environmentalvariables we collect or the vulnerability profiles “explain” some of these differences? BEST analyses Multivariate Analyses
Environmental Data collected through CAMP 1) Water Temperature 2) Water salinity 3) Dissolved Oxygen 4) Tidal level 5) % cover submerge aquatic vegetation 6) % humidity in sediment 7) % Organic content in sediment 8) Mean Grain Size 9) Waterborne nutrient levels
Land Use data from the Atlas 1) Size of Watershed (Km2) 2) Pop Density / watershed (pop / Km2 ) 3) Stream crossing density / watershed (crossing / Km2) 4) % Agricultural area within a watershed 5) % Forest area within a watershed 6) % Urban area within a watershed 7) % streams within forestry land 8) % streams within agricultural land 9) Amount of potential pollution source per watershed
What environmental and LU data explain best the community structure
BEST variables explaining the community assemblage for each site 72.5% of community assemblage variance explained by: • Temperature • Salinity • Eelgrass cover • % Urban land per watershed • Amount of potential pollution source per watershed
% Urban land per watershed Cluster category: • Green : Mabou and Basin Head • Yellow : St. Louis de Kent, Boutouche, Antigonish, Scoudouc, Trout River • Red : Lameque, Shippagan, Pictou, Mill River • Urban land categorized as: • 1) built-up areas • 2) Mines, quarries, sand, gravel pits and open excavation
Amount of potential pollution sources perwatershed Cluster category: • Green : Mabou and Basin Head • Yellow: St. Louis de Kent, Boutouche, Antigonish, Scoudouc, Trout River • Red: Lameque, Shippagan, Pictou, Mill River
Eelgrass cover measured on a scale from 0 to 5. Mabou and Basin Head have in average more eelgrass than Lameque, Shippagan, Mill River and Pictou. Less impacted sites seem to have more eelgrass which would contribute to structuring the community assemblage. Eelgrass cover
Overview of results • Biotic community (abundance and richness) highly differ among all factors of the study design (Site, Station, Month and Year). • Encouraging that we are getting correlation between our CAMP and land use data. We should continue gathering more and better land use data.
Key Recommendations from the workshop • Establish a technical group to review the current CAMP database and make further recommendations and science advice on the sampling protocols, including Station selection, the number of Stations per estuary, sampling frequency and analytical approaches. • Draft Terms of Reference listing the different questions to be addressed by this group has been written. • Technical group will be led by Simon Courtenay and a first meeting should be held in the fall.
Technical Group Example of questions to be addressed by technical group : • Improve characterization of Stations to improve data analyses and interpretation. • Decide how Stations should be distributed within Sites (e.g., randomly assign stations, stations assigned by salinity gradient etc…) • How many ‘’representative’’ Stations should we have in each Site? Could we bring up the number of ‘’representative’’ Stations to 6 at each Site? • What should be the common criteria for Site selection? Geographic or environmental coverage? Size of estuary?
Recommendations • To reduce costs and effort, consider reducing the seasonal sampling to two periods per year (early June and late August). • Consult with technical group and watershed groups • Results from analyses show that: 1) No significant differences were found in the community structure sampled between May and June and also between August and September. 2) Not losing info by dropping May and September which are 2 months that are logistically difficult to sample.
Recommendations • To reduce costs and effort, consider reducing the seasonal sampling to two periods per year (early June and late August). What about July? Staff is available this summer to sample July (Coalition summer students) MREAC informed us they would prefer there be at least 3 months of CAMP data per year (June, July, August), instead of the proposed 2 months. This would provide a better, stronger data set. What do the ENGOs prefer? • Sampling in June and August only • Sampling in June, July and August • For this year the suggestion is not to sample September.
Recommendations • Research: Sample 2 or 3 estuaries more intensively to assess the role of factors such as tide, temperature, position in estuary and sampling intensity on nekton community. • This could involve the participation of a graduate student and ENGOs • Need to consult with technical group to develop a study design to test those different factors.
Recommendations • Validation of land use mapping. Does actual stress (e.g. sedimentation, nutrient loading) match the potential risk defined by the Atlas? • On going process with the Oceans Centre of Expertise on Coastal Management and GIS analyst at DFO. • They are constantly trying to gather more recent and accurate data to improve their Atlas. • This summer we are planning on doing an in-depth field survey at every Stations to gather more details on the littoral shore, backshore and any pollution nearby.
Recommendations 5) Consult with ENGOs: It is recognized that CAMP is a joint collaborative coastal monitoring initiative between DFO and ENGOs and that any changes made to the program need to be made in consultation with the watershed groups.
General Conclusions • CAMP, was first designed to promote stewardship and was then pressed into service to provide managers with information on the ecological health of estuaries and bays. • CAMP was viewed favourably at the workshop and it was concluded that the program is a promising tool to give an indication of the health of bays and estuaries and should be kept. • Results of analyses are encouraging and we now have more data to take informed decisions on any modifications to the protocol. • The value of CAMP, as an indicator of ecosystem health, cannot be completely assessed until we better understand the effects of pressures from human activities on these nekton communities. • Analyses are an on-going process.
What’s next? • Complete the proceedings of the workshop and distribute to ENGOs • Publish DFO technical report describing the sources of variance in the nekton community abundance and diversity analyzed by Roger Green • Make this presentation available to all ENGOs • Initiate the Technical Group • Prepare a report interpreting the data from 2004 to 2009 • Continue monthly sampling for now.