Download
1 / 26
640 likes | 2.39k Views
Lecture 4 Sample size determination. 4.1 Criteria for sample size determination 4.2 Finding the sample size 4.3 Some simple variations 4.4 Further considerations. 4.1 Criteria for sample size determination.

E N D
Lecture 4Sample size determination 4.1 Criteria for sample size determination 4.2 Finding the sample size 4.3 Some simple variations 4.4 Further considerations Statistical Methods in Scientific Research - Lecture 4
4.1 Criteria for sample size determination Suppose that we are to conduct an investigation comparing populations, PA and PB Sample A comprises nA units of observation from PA Sample B comprises nB units of observation from PB Suppose that nA = nB and that n = nA + nB The responses will be quantitative, and the analysis will use a t-test How should we choose n? Statistical Methods in Scientific Research - Lecture 4
Let mA= mean response for PA mB= mean response for PB Null hypothesis is H0: mA= mB From the data, we will obtain the sample means and and sample standard deviations SA and SB for groups A and B Once we have the data, we can: - Reject H0 and say that mA> mB - Reject H0 and say that mA< mB - Not reject H0 Statistical Methods in Scientific Research - Lecture 4
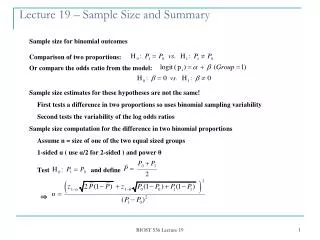
When nA = nB = n/2, the t-statistic is where t will tend to be positive if mA> mB,negative if mA< mB and close to zero if mA= mB Statistical Methods in Scientific Research - Lecture 4
We will: - Reject H0 and say that mA> mBif t k - Reject H0 and say that mA< mB if t -k - Not reject H0 if -k < t < k Say mA < mBDo not reject H0Say mA > mB -k 0 k t Now we need to find both n and k Statistical Methods in Scientific Research - Lecture 4
Suppose that, in truth, mA= mB This does not mean that we will observe nor t = 0 In fact, we may observe t k or t -k, just by chance This means that we might reject H0 when H0 is true This is called type I error Statistical Methods in Scientific Research - Lecture 4
Suppose that, in truth, mA= mB+ d where d > 0, andis of a magnitude that would be scientifically worth detecting We may still observe t k by chance This means that we might fail to reject H0 when H0 is false This is called type II error Statistical Methods in Scientific Research - Lecture 4
The probability that t k or t -k, whenmA= mB, is called the risk of type I error, and is denoted by a (This is for a two-sided alternative: the probability that t k, whenmA= mB, is the risk of type I error for a one-sided alternative and is equal to a/2) The probability that t k, whenmA= mB + d is called the risk of type II error, and is denoted by b The probability that t k, whenmA= mB + d is called the power, and is equal to 1 -b Statistical Methods in Scientific Research - Lecture 4
Reducing type I error Increase k – make it difficult to reject H0 Increasing power Decrease k – make it easy to reject H0 Reducing type I error and increasing power simultaneously Increase n – this will make the study more informative, but it will cost more Statistical Methods in Scientific Research - Lecture 4
4.2 Finding the sample size Suppose that the true standard deviation within each of the populations PA and PB is s Then t Z where Z follows the normal distribution, with standard deviation 1 When mA= mB, Z has mean 0 When mA= mB + d, Z has mean dn/(2s) Statistical Methods in Scientific Research - Lecture 4
Specify that the type I risk of error (two-sided) should be a: P( Z k or Z -k : mA= mB) = a(1) Under H0, Z is normally distributed with mean 0 and st dev 1 k is the value exceeded by a normal (0, 1) random variable with prob a/2 Statistical Methods in Scientific Research - Lecture 4
Specify that the type II risk of error should be b: P( Z k : mA= mB + d) = b(2) Under H0, Z is normally distributed with mean dn/(2s) and st dev 1 k -dn/(2s) is the value exceeded by a normal (0, 1) random variable with prob 1 - b Statistical Methods in Scientific Research - Lecture 4
For a = 0.05 and 1 – b = 0.90, we have k = 1.960 and k -dn/(2s) = -1.282 Thus Statistical Methods in Scientific Research - Lecture 4
Sample size increases: - as s increases - as d decreases - as a decreases - as 1 - b increases Statistical Methods in Scientific Research - Lecture 4
4.3 Some simple variations Unequal randomisation The power of a study depends on which, for equal sample sizes is equal to For nE = RnC, n = RnC + nC and so Statistical Methods in Scientific Research - Lecture 4
Unequal randomisation So, the overall sample size is multiplied by the factor and nE by FE and nC by FC, where Statistical Methods in Scientific Research - Lecture 4
Unknown standard deviation The sample size formula depends on guessing s If this guess is smaller than the truth, the sample size will be too small and the study underpowered If this guess is larger than the truth, the sample size will be too large and the sample size unnecessarily large A more accurate calculation can be based on the t-distribution rather than the normal, but this makes little difference and does not overcome the dependence on s Statistical Methods in Scientific Research - Lecture 4
Unknown standard deviation Often, the final analysis will be based on a linear model, not just a t-test The formulae given can still be used, but s is now the residual standard deviation (the SD about the fitted model) Fitting the right factors will reduce the residual standard deviation, and so the sample size will also be reduced - but you have to guess what s will be in advance! Statistical Methods in Scientific Research - Lecture 4
Sample size for estimation The sample size can be determined to give a confidence interval of specified width W The 95% confidence interval for d = mA -mBis of the form when sample sizes are large (Lecture 1, Slide 24) When nA = nB = n/2, this has length Statistical Methods in Scientific Research - Lecture 4
Sample size for estimation We need to set which means that Statistical Methods in Scientific Research - Lecture 4
Binary data For R = 1, a = 0.05 and 1 – b = 0.90, we have where pC is the anticipated success rate in PC, and pE the improved rate in PE to be detected with power 1 - b Statistical Methods in Scientific Research - Lecture 4
Examples for binary data: R = 1, a = 0.05 and 1 – b = 0.90 Statistical Methods in Scientific Research - Lecture 4
Binary data This approach is based on the log-odds ratio Many other approximate formulae exist All give similar answers when sample sizes are large: exact calculations can be made for small sample sizes Statistical Methods in Scientific Research - Lecture 4
4.4 Further considerations Setting the values for a and b The standard scientific convention is to ensure that a will be small, and allow any risks to be taken with b For example, if an SD or a control success rate is underestimated at the design stage, the study will be underpowered – the analysis maintains the type I error a at the cost of losing power a is the community’s risk of being given a false conclusion b is the scientist’s risk of not proving his/her point Statistical Methods in Scientific Research - Lecture 4
Exceptions If the scientist wishes to prove the null hypothesis (equivalence testing) - then b should be kept small, while a can be inflated if necessary In a pilot study, preliminary to a larger confirmatory study - type I errors can be rectified in the next study, but type II errors will mean that the next study is not conducted at all Statistical Methods in Scientific Research - Lecture 4
Finally: Many more sample size formulae exist – see Machin et al. (1997) Software also exists: nQuery advisor, PASS Ensure that the sample size formula used matches the intended final analysis In complicated situations, the whole study can be simulated on the computer in advance to determine its power Statistical Methods in Scientific Research - Lecture 4