Download

1 / 12
130 likes | 333 Views
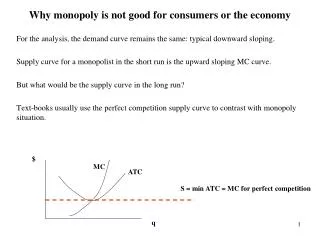
Why monopoly is not good for consumers or the economy. For the analysis, the demand curve remains the same: typical downward sloping. Supply curve for a monopolist in the short run is the upward sloping MC curve. But what would be the supply curve in the long run?

E N D
Why monopoly is not good for consumers or the economy For the analysis, the demand curve remains the same: typical downward sloping. Supply curve for a monopolist in the short run is the upward sloping MC curve. But what would be the supply curve in the long run? Text-books usually use the perfect competition supply curve to contrast with monopoly situation. $ MC ATC S = min ATC = MC for perfect competition q
Contrast Monopoly with perfect competition Imagine a perfect competition case: large number of factories with the same costs curves; and suddenly they are all taken over and owned by one firm, which then operates as a monopoly i.e. the supply curve for both the monopolist and under perfect competition is horizontal- Supply curve is = price under perfect competition, where = MC = min ATC $ MC ATC S = min ATC = MC for perfect competition Pc q
Under monopoly: Demand curve and MR curve Supply curve = min ATC = MC $ A E The Supply under Perfect Competition case is therefore represented by PcE Pc D MR q
Under Perfect Competition, equilibrium output would be at Qp Supply curve = min ATC = MC $ A E Price would be OPc = MC Hence economic efficiency prevails; Price = min.ATC Super-profits = 0 (and good supplied at minimum price possible) Consumer surplus = APcE Pc D MR O q Qp
Monopoly: output where MR = MC ie at Qm Supply curve = min ATC = MC $ A F Pm E Price charged would be OPm which is > MC and > mini.ATC Consumer surplus now = APmF Reduction in consumer surplus = the area PcPmFE. Where does PcPmFE go to? Pc D G MR O q Qp Qm
Where does PcPmFE (areas 1 + 2) go to? $ Supply curve = min ATC = MC A F Pm 2 1 E Since price = OPm while ATC = OPc then PcPm represents his profit per unit of item sold, and so Area 1 = PcPmFG = PcPm*PcG = his super-profit. While a loss to consumers, is it a loss to society? Neoclassical economics: No. Pc D G MR O q Qp Qm
Area 1 is not a welfare loss, in neoclassical economics: 1 bonus mark $ Supply curve = min ATC = MC A F Pm 2 1 E Area 1 is merely an internal transfer within society! But surely 2 questions about this for PICs?: 2 bonus marks. What if the monopolist is rich and the consumers are poor? Does not matter. What if monopolist is foreign investor or local investor who sends profits abroad. ??? Pc D G MR O q Qp Qm
What does the area FGE (2) represent? 1 bonus mark $ Supply curve = min ATC = MC A F Pm 2 1 E Area 2 = FGE = area representing net benefit to consumers lost because some (Qp-Qm) have been pushed out of the market because of the higher prices. ie even though their valuation of the product is higher than the MC of producing it, and they were prepared to pay a price higher than MC, and higher than min ATC. i.e. Area 2 = dead-weight loss to society = and seen by neoclassical economics as the only real loss. Pc D G MR O q Qp Qm
Disadvantages of monopoly: simple analysis $ Supply curve = min ATC = MC A F Pm 2 1 E Price (Pm) is higher than under perfect competition (Pc) Output is lower (Qm) than under perfect competition (Qp): i.e. QmQp consumers pushed out of the market. Pc D G MR O q Qp Qm
Disadvantages of monopoly: strictly $ Supply curve = min ATC = MC A F Pm 2 1 E 1. You have clear dead-weight loss (FGE). 2. Economic inefficiency, Pm is > MC 3. Super-profits since Pm > ATC : unnecessary transfer from consumers to firm. Pc D G MR O q Qp Qm
What does area QmGEQp represent? 1 Bonus mark $ Supply curve = min ATC = MC A F Pm 2 1 E QmGEAp = extra amount that consumers would have spent on this product, were there to be Perfect Competition- but they are now not spending it on this product. Is this a welfare loss? 1 bonus mark. No: spending it on other products- ie merely a “re-allocation of resources” Pc D G MR O q Qp Qm
Footnote: Lerner Index P1 What indicator should one use to measure the extent of damage a monopoly is doing to economic efficiency? What diverges under monopoly? 1 bonus mark. Since economic efficiency requires P = MC The larger is the gap- the worse is impact of monopoly. But how compare impact of monopoly in two different industries, with different prices? Car industry P = 50,000 while MC = 40,000 P-MC= $10,000 In a fridge industry, P = $500 and MC = $300, P-MC = $200 Need proportionate measure: Lerner Index: (P-MC)/P For the car (P-MC)/P = 10,000/50,000 = 0.2 For the fridge (P-MC)/P = 200/500 =0.4 Monopoly impact bigger in the fridge industry.