MEASURES OF VARIABILITY
260 likes | 781 Views
MEASURES OF VARIABILITY. Range Variance Standard Deviation Coefficient of Variation (CV). MEASURES OF VARIABILITY: EXAMPLE. Heights of players of two teams in inches are as follows: Team I: 72,73,76,76,78, so mean=75, median=mode=76

MEASURES OF VARIABILITY
E N D
Presentation Transcript
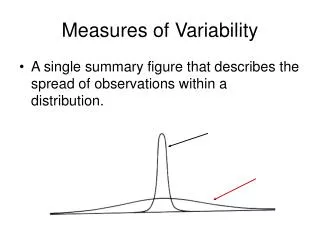
MEASURES OF VARIABILITY • Range • Variance • Standard Deviation • Coefficient of Variation (CV)
MEASURES OF VARIABILITY: EXAMPLE • Heights of players of two teams in inches are as follows: Team I: 72,73,76,76,78, so mean=75, median=mode=76 Team II: 67,72,76,76,84, so mean=75, median=mode=76 • How about the variation?
MEASURES OF VARIABILITYRANGE • The first and simplest measure of variability is the range. • The range of a set of measurements is the numerical difference between the largest and smallest measurements. Range = Largest value - Smallest value
MEASURES OF VARIABILITYRANGE • Team I Range = 78-72 = 6 inches • Team II Range = 84-67 = 17 inches • So, Team I variation is less
MEASURES OF VARIABILITYVARIANCE, STANDARD DEVIATION, CV • A major drawback of the range is that it uses only two extreme values, ignores all the intermediate values, and provides no information on the dispersion of the values between the smallest and largest observations. • On the other hand, variance / standard deviation / CV, uses all the values and provides information on the dispersion of the intermediate values • Computation of variance / standard deviation / CV requires computation of deviation from the mean
MEASURES OF VARIABILITYVARIANCE, STANDARD DEVIATION, CV • Team I deviations from the mean: (72-75)=-3, (73-75)=-2, (76-75)=1, (76-75)=1, (78-75)=3
MEASURES OF VARIABILITYVARIANCE, STANDARD DEVIATION, CV • Team I deviations from the mean: -3, -2, 1, 1, 3 • Sum of deviations from the mean is always 0 e.g., 3-2+1+1+3=0 • Sum of squared deviations from the mean is not necessarily 0 e.g., (-3)2+(-2)2+(1)2+(1)2+(3)2=24 inch2 • Although sum of squared deviations increases if the dispersion increases, the sum depends on the number of measurements. So, mean squared deviations is a preferred measure of dispersion.
MEASURES OF VARIABILITYVARIANCE, STANDARD DEVIATION, CV • Variance is the mean squared deviation e.g., Team I Variance = [(-3)2+(-2)2+(1)2+(1)2+(3)2] / 5 = 4.8 inch2 • Standard deviation is the root mean squared deviation i.e., square root of variance. So, Team I Standard deviation = inches • Coefficient of variation is the standard deviation divided by the mean. So, Team I Coefficient of variation = 2.19 / 75 = 0.0292 = 2.92%
MEASURES OF VARIABILITYVARIANCE, STANDARD DEVIATION, CV • Why there are three similar terms? • In the above example, variance has unit inch2, but standard deviation has unit inch - the unit of the original data. So, standard deviation may sometimes be preferred over variance. • Coefficient of variation is dimension less. Hence, coefficient of variation is a useful quantity for comparing the variability in data sets having different standard deviations and different means
MEASURES OF VARIABILITYVARIANCE, STANDARD DEVIATION, CV • Interpret standard deviation • It’s difficult to interpret • Larger amount of standard deviation implies greater variability • Standard deviation is widely used to approximate the proportion of measurements that fall into various intervals of values. This is specially true if the data has a bell-shaped distribution.
MEASURES OF VARIABILITYVARIANCE, STANDARD DEVIATION, CV • Interpret standard deviation • An Empiricial Rule states that if the data has a bell-shaped distribution, • approximately 68% measurements fall within one standard deviation of the mean i.e., between (mean-standard deviation) and (mean+standard deviation) • approximately 95% measurements fall within two standard deviations of the mean, and • virtually all the measurements fall within three standard deviations of the mean
Mean -3 -2 -1 +1 +2 +3 68.26% 95.44% 99.74% MEASURES OF VARIABILITYVARIANCE, STANDARD DEVIATION, CV
MEASURES OF VARIABILITYVARIANCE, STANDARD DEVIATION, CV • Interpret standard deviation • Example: suppose that the final marks has a bell-shaped distribution, with a mean of 75 and a standard deviation of 7. Then, • approximately 68% marks fall between (75-7)=68 and (75+7)=82. • approximately 95% marks fall between (75-27)=61 and (75+27)=89, and • virtually all the measurements fall between (75-37) =54 and (75+37)=96