Download
1 / 33
330 likes | 357 Views
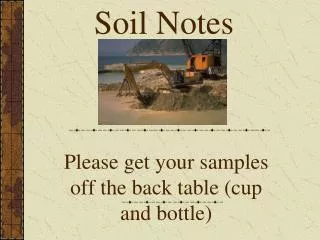
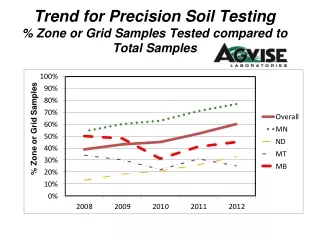
Trend for Precision Soil Testing % Zone or Grid Samples Tested compared to Total Samples. AGVISE Laboratories % Zone or Grid Samples Tested Compared to Conventional Whole Field Composite Samples in 2012. AGVISE Laboratories %Zone or Grid Samples – Northwood laboratory 1997 - 2012.

E N D
Trend for Precision Soil Testing% Zone or Grid Samples Tested compared to Total Samples
AGVISE Laboratories%Zone or Grid Samples Tested Compared to Conventional Whole Field Composite Samples in 2012
AGVISE Laboratories%Zone or Grid Samples – Northwood laboratory1997 - 2012 % Grid or Zone Samples Tested Compared To Conventional Whole Field Composite Samples Tested
Average Soil Nitrate following Wheat in 2012 MB Fall 2012 Samples 44 (lb/a 0-24” samples) 48 43 65 38 64 41 42 33 47 47 44 44 ND 50 51 43 48 50 42 57 MN 50 67 SD 39 43
Drought Average Soil Nitrate Following “WHEAT” in Canada 1986-2012 107 96 81 68 64 59 58 56 Nitrate-N (0-24”) lb/a 52 50 50 50 50 49 49 47 46 42 42 41 40 39 39 38 35 34 34 86 88 90 92 94 96 98 00 02 04 06 08 10 12
Soil Nitrate Variability Between Fields Following “Wheat” in Canada - 2012
Average Soil Nitrate following Canola in 2012 MB Fall 2012 Samples 43 (lb/a 0-24” samples) 63 54 72 47 74 50 75 49 46 40 ND 41 48 MN SD
Soil Nitrate Variability Between Fields Following “Canola” in Canada – 2012
Average Soil Nitrate Following “Canola” in Canada 1988-2012 82 75 60 60 58 57 57 54 53 51 49 45 44 44 43 Nitrate-N (0-24”) lb/a 40 40 37 36 36 35 34 32 32 29 88 90 92 94 96 98 00 02 04 06 08 10 12
Soil Nitrate Variability Between Fields Following “Barley” in Canada - 2012
Average Soil Nitrate Following “BARLEY in Canada 1986-2012 81 70 66 64 64 60 58 58 58 55 54 53 50 50 49 49 47 Nitrate-N (0-24”) lb/a 46 45 44 43 39 38 37 37 36 35 86 88 90 92 94 96 98 00 02 04 06 08 10 12
Soil Nitrate Variability Between Fields Following “Flax” in Canada - 2012
Average Soil Nitrate Following “FLAX in Canada 1988-2012 89 87 64 60 58 56 55 Nitrate-N (0-24”) 51 48 47 45 42 42 40 39 38 38 37 38 34 34 32 31 29 24 88 90 92 94 96 98 00 02 04 06 08 10 12
Soil Nitrate Variability Between Fields Following “Potato” in Canada - 2012
Average Soil Nitrate Following “POTATO” in Canada 1988-2012 106 96 93 92 81 81 79 74 73 72 72 70 69 68 67 Nitrate-N (0-24”) 62 61 55 54 54 51 50 46 34 39 88 90 92 94 96 98 00 02 04 06 08 10 2011
Average Soil Nitrate following Corn in 2012 Fall 2012 samples MB (lb/a 0-24” samples) 89 63 113 54 67 46 50 ND 68 54 52 44 57 63 64 MN 77 56 SD 85 83 114 62
Soil Nitrate Variability Between Fields Following “Corn” in Canada - 2012
Average Soil Nitrate Following “CORN in Canada 1988-2012 117 106 96 93 90 84 85 85 80 77 Nitrate-N (0-24”) 71 65 64 65 64 63 60 59 58 55 54 54 54 45 42 88 90 92 94 96 98 00 02 04 06 08 10 12
Soil Nitrate Variability Between Fields Following “Soybean” in Canada 2012
Average Soil Nitrate Following “Soybeans” in Canada 2008 2009 2010 2011 2012 607 827 865 1350 1579 # of Fields Tested
% Soil Samples with Phosphorus less than 10 ppm Fall 2012 samples MB 38% (0-6” samples) 35% (Olsen P test) 50% 58% 20% 60% 27% 14% 34% 78% 66% 77% 55% 67% 72% ND 47% 57% 69% 56% 68% 36% 71% MN 47% 57% 36% SD 36% 46% 60% 50% 32%
% Soil Samples with Potassium less than 150 ppm MB Fall 2012 samples 32% 11% (0-6” samples) 38% 32% 19% 6% 11% 30% 17% 2% 3% 2% 14% 77% 36% ND 5% 21% 78% 7% 48% 6% 48% 1% 4% 23% MN 31% SD 41% 1% 3% 21% 35%
% Soil Samples with Zinc less than 1.0 ppm MB Fall 2012 samples 35% 59% (0-6” samples) 53% 65% 32% 66% 49% 24% 35% 72% 83% 56% 78% 44% ND 54% 77% 22% 86% 65% 65% 20% 91% 50% MN 59% 35% SD 26% 74% 49% 36% 34%
% Soil Samples with Sulfur less than 15 lb/a MB Fall 2012 samples 10% 7% (0-6” samples) 11% 5% 9% 12% 15% 9% 12% 54% 14% 22% 8% 32% 9% ND 18% 38% 10% 40% 21% 49% 46% 29% MN 67% 20% 49% SD 27% 69% 59% 19% 44%
% Soil Samples with %OM less than 3.0% MB Fall 2012 Samples 9% 8% (0-6” samples) 20% 13% 33% 29% 29% 17% 25% 71% 33% 43% 22% 21% 26% ND 25% 60% 75% 26% 28% 38% 26% 55% MN 28% 12% 9% SD 17% 28% 3% 26% 9%
% Soil Samples with Chloride less than 40 lb/a MB Fall 2012 Samples 51% (0-24” samples) 34% 55% 78% 13% 59% 42% 47% 30% 89% 56% 65% 38% 20% 63% ND 59% 85% 41% 48% 87% 77% 85% 44% MN 70% 84% SD 57% 78% 57%
% Soil Samples with Copper less than 0.5 ppm MB Fall 2012 samples 15% 7% (0-6” samples) 24% 4% 26% 12% 10% 14% 16% 2% 17% 2% 12% 29% 41% ND 7% 45% 10% 20% 13% 10% 26% 14% 5% MN 5% 4% SD 2% 1% 5% 0%
% Soil Samples with Boron less than 0.4 ppm MB Fall 2012 samples 1% (0-6” samples) 0% 1% 0% 4% 2% 8% 13% 1% 5% 2% 4% 7% 17% 5% ND 2% 15% 39% 75% 3% 15% 47% 8% 9% MN 9% SD 8% 27% 9% 35% 12%
% Soil Samples with Soil pH greater than 7.3 MB Fall 2012 samples 65% 92% (0-6” samples) 82% 74% 84% 71% 42% 72% 75% 62% 70% 51% 76% 67% 96% ND 38% 6% 65% 39% 79% 35% 43% 15% 23% MN 36% 54% SD 34% 25% 23% 27% 22%
% Soil Samples with Carbonate greater than 5.0% MB Fall 2012 samples 36% (0-6” samples) 55% 22% 22% 24% 10% 14% 40% 17% 10% 13% 7% 26% 44% 9% ND 6% 3% 12% 23% 6% 4% 1% 2% MN 9% 29% SD 6% 1% 10% 3% 10%
% Soil Samples with Salts greater than 1.0 MB Fall 2012 Samples 11% 17% (0-6” samples) 17% 23% 21% 10% 8% 12% 17% 2% 15% 8% 37% 19% 6% ND 10% 4% 0% 1% 27% 19% 3% 2% 21% MN 11% 4% SD 7% 1% 6% 12% 2%
Manitoba - % Samples Testing with Salts greater than 1.0 582 NE ND R0G R0K 1:1 salt method – expressed as mmhos/cm
The Salt Problem may be Worse than this? • Composite samples • Avoid areas that don’t represent most of the field • Saline areas • Sandy ridges • Many salty fields don’t get tested • Zone sampling • The salty zones often do not get tested or fertilized