Science Night Presentation
Science Night Presentation. Middle School Choices. First Choice Bridges only for 7 th and 8 th graders. Individual projects Due date: November 19, 2014 Supplies needed are wood, glue and cutter. Items will be pre-sold on October. Rules do not arrive until mid- to late October.

Science Night Presentation
E N D
Presentation Transcript
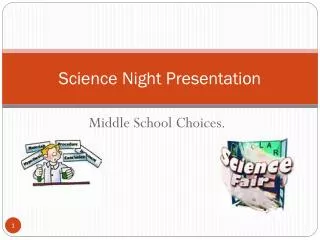
Science Night Presentation Middle School Choices.
First Choice Bridges only for 7th and 8th graders • Individual projects • Due date: November 19, 2014 • Supplies needed are wood, glue and cutter. • Items will be pre-sold on October. • Rules do not arrive until mid- to late October. • Workshop for parents and students after rules are released.
Second Choice • Individual project • Due date a week earlier November 12, 2014. • Project will be presented via power point presentation. • Top two students from each science class will be chosen to attend the in-house science fair. Those students are chosen by their science teacher. • Chosen students will be given the science board and students will bring back on Monday, November 24 to their teacher.
Need to have Power Point program • Our school only has access to power point so their presentation needs to be compatible to our programs. • Needs to be 2003 or higher. Not a 2010 version. If so do a “save as” 2007 or less. • If you do not have the correct power point program the computer lab is opened daily from 7:45 a.m. to 8:15 a.m.
How to do a save as in a lower version • Click on File, save as, save as type, find Power point 97-2003 or Power Point presentation 2007 or less. • Students needs to bring their project on a USB drive except for Research paper and bibliography.
Parts of the Power Point • Each part can be in more than one slide. Keep the font at 24. • Slide 1: Title of Project (should be catchy and relevant to what is being taught.) • Name of student • Teacher Name and Period • No pictures on power point except for pictures of the experiment working for qualitative data.
Problem Statement and Hypothesis • Should fit within 1 slide. • Problem Statement: includes independent, dependent variable and the metric units that will be used to measure the results • Which brand of paper towels: Bounty, Brawny or Viva will hold the most mL of water? • Hypothesis: Includes If and then (if: is what your are doing, then: is what you expect to happen) • If I pour water into Bounty, Brawny, or Viva, then Viva will hold the mL of water.
Materials • Always written as a list. Includes quantity, amounts and what you are using. • This part can take more than 1 slide: • 3- 10x11cm sheet of Viva • 3- 200 mL plastic measuring cup • 3- 150 mL of tap water
Abstract • Abstract: This is a summary of the entire experiment. No more than 250 words (be sure to use a word count). • Written in 3 paragraphs: • 1st paragraph: What you are trying to find out with your experiment (problem statement). What you expect to happen (hypothesis). All written in a statement form. • 2nd paragraph: Brief summary how the experiment was done. Not done in a list. • 3rd paragraph: explain the results (averages or data for each trial) and if the hypothesis was correct or not.
Variables • Independent Variable – what you are testing that is different: paper towels • Dependent Variable- the outcome : amount of water • Control group- none ( Not all experiments need a control group) • Constants: • Size of paper towel • Amount of water • Size of beaker • Amount of time towel is soaked in water
Results • Results- after trial 1- Brawny held 50 mL of water, Bounty 75 mL of water and Viva 80 mL of water. After trial 2 Brawny held 60 mL of water, Bounty 75 mL of water and Viva 80 mL of water. After trial 3- Brawny held 50 mL of water, Bounty 100 mL of water and Viva 80 mL of water. • Qualitative data- The Viva soaked up the water the fastest. Brawny broke really quick and Bounty did not allow water to drip.
How to do the graph on power point. • Click on bar graph in middle of slide. Choose 3D column. • You will see an excel spread sheet. On vertical column put the trials. On horizontal row write the independent variable. Put your data do not forget to also include the average for each item. • Click on graph and look for chart styles. This will allow you to click on the graph that shows a title, and x and y axis subtitles. Type in area and it will automatically show on the graph.
Pictures • Include pictures of the experiment as it is occurring. Download to the computer and attach to the slide. • All pictures need a caption.
Procedures • Written and as a list and numbered: Needs to be detailed so another individual could replicate the entire process. • Step 1: Gather materials • Step 2: cut Brawny, Bounty and Viva into 10 x 11 cm sheets. • Step 3: Pour 150mL of tap water into 200 mL plastic beaker • Step 4: put Brawny 10x11cm paper towel sheet into beaker. • Step 5: set timer for 10 seconds. • Step 6: lift Brawny and let excess water drip into beaker. • Step 7: measure the amount of tap water left in the beaker. • Step 8: record the data • Step 9: repeat the process for each paper towel • Step 10: repeat the entire process two more times
Conclusion • Written in 3 paragraph • 1st paragraph answers questions 1-3 in complete sentences • 2nd paragraph includes question 4 (this questions refers to the research done and how it applies to the results of your experiment • 3rd paragraph includes questions 5-7
Print a copy of Power Point Presentation for the science teacher • To print a copy of the power point: Hit print and look in the bottom left slide and look for section that says print what: click on hand out. This will then show you how many slides per page you can print. Click on 4 slides per page and click on okay. • 2010 Power Point just look for Print slides and click to find the option.