Download

1 / 32
320 likes | 644 Views
ITCSO Training Academy. Contract Audit Follow-Up (CAFU) 3.5 Pre-Defined & Ad hoc Reports November 2009. Course Topics. Course Topics. Note : Links will only work in PowerPoint's slide show view. . Module One – Pre-Defined Reports. Module One Pre-Defined Reports.

E N D
ITCSO Training Academy Contract Audit Follow-Up (CAFU) 3.5 Pre-Defined & Ad hoc Reports November 2009
Course Topics Course Topics Note: Links will only work in PowerPoint's slide show view.
Module One – Pre-Defined Reports Module One Pre-Defined Reports
Module One – Objectives At the end of Module One you should be able to:
Lesson One – Overview of Pre-Defined Reports Lesson One Topics
Topic One – How to Access Pre-Defined Reports 1 Accessing CAFU Pre- Defined Reports CAFU Reporting Interface opens with the Report List displayed (Graphic 1.1). Graphic 1.1: CAFU 3.5 Reports Page
Topic Two – Report Formats Four Report Formats Graphic 1.2 shows the Pre-Defined reports for CAFU 3.5. You can view these reports in any of the following four formats (Graphic 1.3): Graphic 1.3: Report Formats Graphic 1.2: Report List
Topic Three – Running Pre-Defined Reports Select Report and Format Type – Step 1 Locate the Report you would like to view from the Report List. For demonstration purposes, the “CAFU Audits by Resolution Status” Report will be selected. Graphic 1.4: CAFU 3.5 Reports Page
Topic Three – Running Pre-Defined Reports Setting Report Filters - Step 2 After clicking the report type and view format, the report filter page appears. This page allows you to select specific criteria’s for filtering the data you will see on your report. • Filter common elements: • Fields with an * are required • A red arrow will appear next to required lists prompting users to make a selection • Clicking the Select all link selects all of the items in the list • Clicking the Deselect all link deselects all of the selected items from the list • It is recommended NOT to select all items for “Optional” lists as it may cause an error or take time to process • Dynamic lists are not populated until data in a prior list is selected and the cascading prompt button is clicked Graphic 1.5: CAFU Report Filter Page
Topic Three – Running Pre-Defined Reports 1 2 3 4 5 Setting Report Filters (Continued) Graphic 1.6: CAFU Audits by Resolution Status Report Filter Page
Topic Three – Running Pre-Defined Reports Viewing Your Completed Report – Step 3 All Reports can be run in a similar process as the steps illustrated in the previous slides. The results will look similar to those in Graphic 1.7 below. Graphic 1.7: CAFU Audit s by Resolution Status Report Results
Module One Review Module One Covered the Following Topics:
Module Two – Ad hoc Reports Module Two Ad hoc Reports
Module Two – Objectives At the end of Module Two you should be able to:
Module Two – Ad hoc Reports Module Two Lessons
Lesson One – Overview of Ad hoc Reports Lesson One Topics
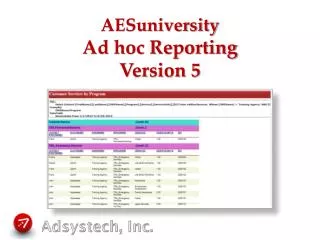
Topic One – Ad hoc Reports Overview Ad hoc Reports Allow: • The user to customize a data query in real time • The user to select specific fields and define the search criteria • The user to create a report view. • The user to select the web location to publish and save Graphic 2.1: Ad hoc Main Page
Topic Two – How to Access Ad hoc Reports 1 2 Accessing Ad hoc Reports from within CAFU Reporting Interface Graphic 2.2: Reports Main Menu Graphic 2.3: Ad hoc Main Menu
Topic Three – Saved Query List Saved Query List Graphic 2.4: Ad hoc Saved Query List Graphic 2.5 Ad hoc Saved Query List
Topic Four – Query Studio Components Query Studio Components • This diagram depicts the different components for Ad hoc reporting. • Toolbar • Main Menu • Reports Area • The Toolbar provides a shortcut to some of the Main Menu functionality. 1 2 3 Graphic 2.6: Ad hoc Components
Lesson Two – Query Studio Lesson Two Topics
Topic One – Query Studio Main Menu 1 Query Studio Main Menu Graphic 2.7: Query Studio Main Menu
Topic One – Query Studio Main Menu Query Studio Main Menu (Continued) Graphic 2.8 to 2.11 depicts the different main menu options and the corresponding main menu hyperlinks. Graphic 2.11: Query Studio Manage File Main Menu Graphic 2.8: Query Studio Edit Data Main Menu Graphic 2.9: Query Studio Change Layout Main Menu Graphic 2.10: Query Studio Run Data Main Menu
Topic Two – Query Studio Toolbar Using the Query Studio Toolbar Graphic 2.12 shows the Ad hoctoolbar. Graphic 2.13 highlights the most frequently used icons. The (save and save as ) icons are used to save reports. The (cut and paste) icons are used to cut and paste data anywhere on the report. The (undo and redo ) icons are used to undo and redo last changes. The (run with all data and re-prompt) icon allows you to run the report or re-prompt the report. The (filter and sort icons) allow you to filter and sort on specific data. These icons are used to summarize and calculate. Graphic 2.12: Ad hoc Toolbar Graphic 2.13: Ad hoc Toolbar
Topic Three – Creating Ad hoc Reports 1 2 Selecting No Data before Design – Step 1 The Run Report link will give you data view options, allowing you to build a report with all data, limited data, or with no data. In order to optimize the load time while designing the report, it is recommended to select the Preview with No Data options. Graphic 2.14: Ad hoc Run Report Menu
Topic Three – Creating Ad hoc Reports 1 2 Selecting Data – Step 2 Graphic 2.15: Ad hoc Insert Data Menu
Topic Three – Creating Ad hoc Reports 1 2 3 Filtering Data – Step 3 Graphic 2.16: Unfiltered Report
Topic Three – Creating Ad hoc Reports 4 Filtering Data – Step 3 (Continued) Note: Report data should be filtered to avoid retrieving too many records and causing a fatal error. Graphic 2.17: Filter Screen
Topic Three – Creating Ad hoc Reports 1 Removing a Filter Graphic 2.18: Filtered Report
Topic Four – Running Ad hoc Reports 1 2 3 How to Run Ad hoc Reports With All Data The Run Report link will give you data view options, allowing you to build a report with all data, limited data, or with no data. Once you are satisfied with the layout of your report you are ready to run the report with all data. Graphic 2.19: Ad hoc Run Report Menu Graphic 2.20: Report with All Data
Topic Four – Running Ad hoc Reports 1 2 3 Exporting Data The second set of links of the Run Report Main Menu allow the report to be exported in PDF, Excel, CVS or XML format. Note: Reports exported to PDF, Excel, CVS or XML format are saved to the users hard drive. Graphic 2.22: Report with All Data Graphic 2.21: Ad hoc Run Report Menu Graphic 2.23: Report Exported to Excel
Module Two Review Module Two Covered the Following Lessons: