Download
1 / 11
110 likes | 190 Views
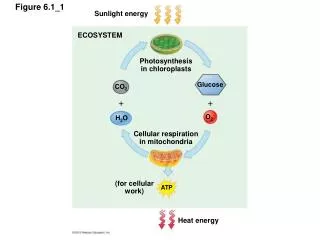
Explore the intricate processes of photosynthesis in chloroplasts, cellular respiration in mitochondria, energy consumption during activities, and the generation of ATP in metabolic cycles.

E N D
Figure 6.1_1 Sunlight energy ECOSYSTEM Photosynthesisin chloroplasts Glucose CO2 O2 H2O Cellular respirationin mitochondria (for cellularwork) ATP Heat energy
Figure 6.2_1 Breathing CO2 O2 Lungs CO2 O2 Bloodstream Muscle cells carrying out Cellular Respiration CO2 H2O ATP Glucose O2
Figure 6.4 kcal consumed per hourby a 67.5-kg (150-lb) person* Activity Running (8–9 mph) 979 Dancing (fast) 510 Bicycling (10 mph) 490 Swimming (2 mph) 408 Walking (4 mph) 341 Walking (3 mph) 245 Dancing (slow) 204 Driving a car 61 Sitting (writing) 28 *Not including kcal needed forbody maintenance
Figure 6.5A Loss of hydrogen atoms(becomes oxidized) ATP O2 6 CO2 6 H2O C6H12O6 6 Glucose Heat Gain of hydrogen atoms(becomes reduced)
Figure 6.7Ca_s2 3 2 3 4 4 1 1 ENERGYINVESTMENTPHASE Glucose Steps – A fuelmolecule is energized,using ATP. ATP Step ADP Glucose 6-phosphate P P Fructose 6-phosphate ATP ADP Fructose 1,6-bisphosphate Step A six-carbonintermediate splitsinto two three-carbonintermediates. P P Glyceraldehyde3-phosphate (G3P) P P
Figure 6.7Cb_s2 7 7 8 8 9 9 5 5 5 6 6 9 6 ENERGYPAYOFFPHASE P P NAD NAD Step A redox reactiongenerates NADH. P P NADH NADH H H 1,3-Bisphospho-glycerate P P P P ADP ADP Steps – ATP and pyruvateare produced. ATP ATP 3-Phospho-glycerate P P P P 2-Phospho-glycerate H2O H2O P P Phosphoenol-pyruvate (PEP) ADP ADP ATP ATP Pyruvate
Figure 6.9B_s3 2 1 4 5 3 4 5 1 2 3 Acetyl CoA CoA CoA 2 carbons enter cycle Oxaloacetate Citrate H NADH NAD NAD NADH H Citric Acid Cycle leaves cycle CO2 Malate Alpha-ketoglutarate FADH2 leaves cycle CO2 FAD NAD Succinate ADP H P NADH Steps –NADH, ATP, and CO2are generated during redox reactions. Steps –Further redox reactions generateFADH2 and more NADH. StepAcetyl CoA stokesthe furnace. ATP
Figure 6.5C 1 2 NADH NAD ATP 2 Controlledrelease ofenergy forsynthesisof ATP H Electron transport chain 2 O2 2 H H2O
Figure 6.10 1 2 H H H H H Mobileelectroncarriers H Intermem-branespace H Proteincomplexof electroncarriers H H ATPsynthase III IV I Inner mito-chondrialmembrane II FADH2 FAD Electronflow 2 H H2O O2 NAD NADH H Mito-chondrialmatrix ADP P ATP H Chemiosmosis Electron Transport Chain Oxidative Phosphorylation
Figure 6.6_1 CYTOPLASM NADH Electronscarried by NADH FADH2 NADH OxidativePhosphorylation(electron transportand chemiosmosis) Glycolysis PyruvateOxidation Citric AcidCycle Pyruvate Glucose Mitochondrion ATP ATP ATP Substrate-levelphosphorylation Substrate-levelphosphorylation Oxidativephosphorylation
Figure 6.7A Glucose 2 ADP 2 NAD 2 P 2 NADH ATP 2 2 H 2 Pyruvate