Download
1 / 44
440 likes | 549 Views
This document outlines the California PATH initiative in collaboration with UC Berkeley focused on improving intersection safety through an Integrated Decision Support (IDS) system. It emphasizes the critical need for effective management of left-turn across path/opposite direction (LTAP/OD) conflicts, a leading cause of intersection crashes. The approach integrates vehicle and infrastructure communications to design an advanced alert system, providing real-time warnings to drivers. Future testing and simulation will further enhance the understanding and effectiveness of intersection safety measures.

E N D
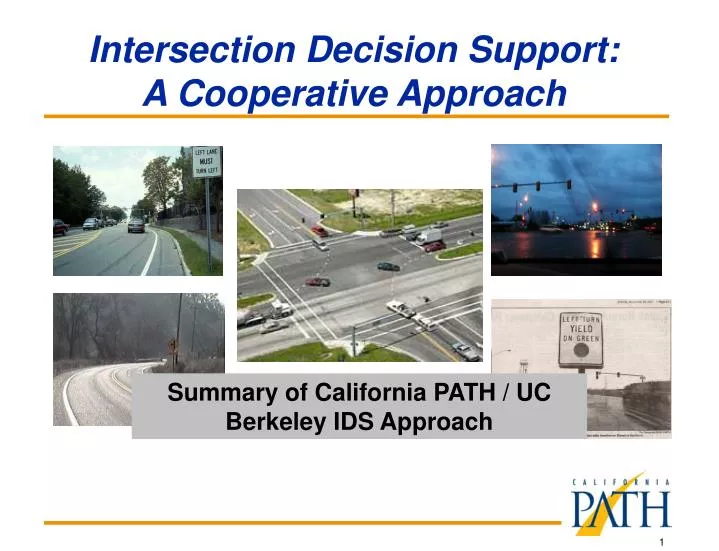
Intersection Decision Support: A Cooperative Approach Summary of California PATH / UC Berkeley IDS Approach
Outline • Background • California Approach • Work Plan • IDS Architecture • Underpins California Concept of Operations • Integrating the Driver • Aimed at IDS Alert System Design • Alert System Design • Approach to Cooperative Systems
Driver Decision Support Concept • Emphasis on crossing-path collisions (both signalized and unsignalized) • 80% of intersection crashes (1998 GES) • Concept and architecture accommodate other intersection crash types • Find “best” combinations of vehicle and infrastructure responsibilities for diverse intersections
California Areas of Interest • LTAP/OD conflicts at signals (permissive, not protected) • LTAP/LD conflicts at urban stop signs • Development of broad system architecture applicable to all intersection crash types, using information from infrastructure and/or vehicles • Development of wireless communications to connect infrastructure and vehicles • Pedestrian and bicyclist conflicts
California’s Primary Focus Area: LTAP/OD • Features of California LTAP/OD Approach • Problem is gap decision in presence of oncoming vehicles • For all traffic control devices: signal, stop sign, no controls • High potential for initial infrastructure-based warning application (“Driver Infrastructure Interface”, DII) • Takes advantage of left turn dynamics • If designed correctly, DII for left turn driver is unambiguous • DII located at far side corner, where driver is likely to scan • Cooperative (wireless) systems should enhance system
Definition: Left Turn Across Path / Opposite Direction (LTAP/OD)
Principal Expected Products • Quantitative characterizations of intersection safety problems and turning behavior at intersections • Recommended designs for infrastructure elements and systems (sensors and their locations, algorithms to use sensor outputs to alert drivers, and displays) • Estimates of effectiveness of IDS in reducing intersection crashes • Plans for public operational test(s) at selected intersections
Characterize Intersection Driving • Roadside Observations • Driver Observations Develop Simulation Tool Implement RFS Test Intersection Develop DII Design IDS Alert System Develop Wireless Communication System Driving Experiments At RFS Intersection Evaluate COTS Technologies Schematic of California Approach
Task List and Status (1 of 2) • Completed Tasks: • A. Problem Assessment • Deliverables: Problem Assessment Reports • M. Mid-term demonstration • Deliverable: Year 1 Report (in process) • Current Tasks: • B. Characterize Intersection Driving • Deliverables: Pilot Feasibility Study, Extended Observation Study, Field Collection, Lag Acceptance Reports (early 05) • C. Wireless Communication Development • Deliverables: Protocol Design Report (July 04), Communication Prototype and Performance Analysis Report (early 05) • D. Driver-Infrastructure-Interface Usability • Deliverables: DII Usability Report (early 05), DII Alternatives Report (early 05) • E. Develop Warning System • Deliverable: Warning System (early 05)
Task List and Status (2 of 2) • Current Tasks (Cont’d) • S1. Develop Simulation Tool • Deliverables: Tool (Nov 04) • S2. Evaluate COTS Technologies • Deliverables: COTS System Downselect (Sep 04), Test Reports (Sep 04 – early 05) • Future Tasks • F. Countermeasure Trade-off Analysis • Deliverables: Sensor Fusion Report (Oct 04), Report to Compare Countermeasures (early 05) • G. Pilot FOT Planning • Deliverable: Final Report with FOT Plan (early 05)
StateMap-based Architecture Safety applications Conflictpredictor Gap predictor Stop predictor Statemap State Map Generator Comm. Sensors Car GPS Lidar/Radar Other Loops
Diverse IDS Implementations Infrastructure Vehicle Data Sources: Loop Detectors Video Detectors Radar In-vehicle sensors (wireless) • IDS Logic: • Analyze vehicle motions • Predict future gaps, conflicts • or violations • Decide to issue alert (wireless) In-vehicle display Information to Drivers: Dynamic Sign Signal Controller
Implementation at TFHRC (1 of 3) Fixed (Infrastructure) Sensors Denso LIDAR (2) Loops (11) EVT-300 (2) Serial Serial DII QNX6 Computer (Sensor Fusion, Warning, and Tracking Algorithms) Digital HI/LO Ethernet Serial Wireless Modem 2070 Controller Controller Cabinets
Implementation at TFHRC (2 of 2) QNX 6.0 computer (State map visualizer) Wireless 802.11a PCMCIA / PCI card vehicles infrastructure 802.11a safety enhanced (more DSRC like) Sensors 2070 contr. DII Ethernet Wireless 802.11a PCMCIA / PCI card Eth. card RS232 I/O card QNX 6.0 computer (Sensor fusion, safety IDS algorithms)
Traffic Controller Cabinet Embedded Loop Detectors 60 Meters of 3M Microloops Signal Poles Radar Poles PATH RFS Test Intersection
Elements of Cooperative System at the PATH Intelligent Intersection • 40-ft Bus at PATH/RFS • DVI at driver console, with identical display for passengers • Wireless implementation of simultaneous DII and DVI • In practice, need not be simultaneous – a tricky research item • Demonstrated to Barbara Sisson Associate Administrator for Research, FTA
‘State Map’ of Intersection at ControllerWe know the status of every communicating entity
108 m 4 s 161m 6s 214 m 8 s 125 m 4.69 s 191 m 7.18 s 158 m 5.93s 80 m 3 s 184 m 6.91 s 132 m 4.96 s 51 m 3.8 s 100 m 7.5 s 149 m 11.2 s 106 m 7.9 s 150 m 11.7s 206 m 15.4 s 104 m 7.8 s 228 m 17 s 166 m 12.5s Perception - Difficulty Estimating Speed(Staplin, 1995) 60 mph Age 75-91 Age 56-72 Age 20-53 100 200 10 50 150 30 mph
Observations and Experiments (1 of 3) • Three Driver Experiments • Downtown Berkeley (ongoing) • Microscopic: 0.075-sec resolution • Over 400 intersection traverses • Defining key waypoints • Experimental Intersection: D2I vs T2I • Experimental Intersection: How well does our warning system / nominal DII work?
Crossing time Turning time Waiting time Parameter Definitions
Observations and Experiments (2 of 3) • Characterizing Driver Behavior at Intersections • Four sites • Two in Berkeley • Pinole • Burlingame (near SFO) • San Francisco • Two approaches • Roadside • In-Vehicle • At least three warning algorithm approaches • Dynamic (Shladover) • “BMI-based”/Statistical (Ragland) • Neural net (Misener) • Transcends LTAP/OD
Observations and Experiments (3 of 3)Driver Infrastructure Interface (DII) • Depth: “Looming Circle” DII further investigated • Our nominal DII • Breadth: Based on CTCDC preparations and recommendations from committee, alternate DIIs to be considered
Instrumented Ford Taurus for Driving Data Collection • Wireless connection from laptop to PC104 in traffic signal control cabinet • Intended Field data collection and controlled tests at RFS
Output: Inputs to Alert System Design • Roadside observations (by radar and video): • SV turning times • POV speed distribution • Accepted and rejected turning gaps • SV/POV speed change interactions • Behavior changes based on signal phase • Interactions with pedestrians • Instrumented vehicle field tests: • Detailed SV speed-based information • Timing of turning decision • Waypoints within turning movement (e.g., decision point, waiting time turning time) • Influence of driver age and gender on turning behavior
Characterize Intersection Driving • Roadside Observations • Driver Observations Develop Simulation Tool Implement RFS Test Intersection Develop DII Design IDS Alert System Develop Wireless Communication System Driving Experiments At RFS Intersection Evaluate COTS Technologies Central Role of Alert System Design
Alert System Requirements • Very low false negatives – consistently alert to hazardous conditions • Low false positives – avoid alerting under benign conditions • Appropriate timing of alert onset • Do as well as possible with imperfect sensor data • …while recognizing inherent limitations: • Subjective judgments of gap suitability • Diversity of driving population preferences
Single LTAP/OD Encounter POV1 SV POV2 SV “Leading Buffer time” after POV1, ahead of SV “Trailing Buffer time” after SV, ahead of POV2
LTAP/OD Alert Design Goals • When an SV may be planning to make a left turn (in LT pocket or left lane, if no pocket): • Provide alert for gaps in POV traffic shorter than minimum “safe” threshold • Don’t alert if POV gap is longer than acceptable threshold (avoid nuisance alerts) • Time the alert to be early enough for SV driver to be able to make a comfortable “no turn” decision, but not so early that it could be perceived a nuisance. • First define alert design assuming complete and accurate sensor data, then adjust for imperfect data
Nominal Alert Triggering Approach • Develop for middle of green phase, then adjust for other conditions • Anticipate when SV will enter dangerous region (in path of POVs), and how long it will need to clear that region • Define acceptable time gap in approaching POV traffic after SV will clear intersection(“Trailing Buffer” time values based on field measurements and driver experiments, initial estimate ~ 3 s) • Apply hysteresis in acceptable gap times to avoid chatter – Tgaplow and Tgaphigh, initially separated by 1 s (final value to depend on sensor and data fusion capabilities).
Alert Development Process • Define alert criteria, considering “all” expected combinations of conditions • Based on information from observation studies (roadside and in-vehicle) • Adjustments for diverse intersection conditions • Test alert criteria in simulation under challenging conditions, then adjust as necessary • POV speed changes (dilemma zone decel. and accel., decel. to turn) • Range of approach speeds • Range of relative arrival times of SV, POV • Test sensor alternatives to compare to “perfect” sensor information
Alt. 1 Alt. 2 Alt. 3 Alt. 4 Alt. 5 Alt. 6 Double loop detector Single loop detector Radar coverage zone Standard loops at stop bar Sensor Coverage Alternatives Double loop detector
General Findings on Alert Design and Detection Needs • Complex interactions between SV and POV speeds need to be evaluated in multiple cases • Early enough detection of POV is essential (6 seconds before stop bar) • Use of final four loops at SV stop bar is crucial for determining SV speed in difficult cases • Alerts depend on accurate speed as well as presence information • POV speed changes close to intersection are not as important as SV speed changes
Importance of Accurate Speed Measurements • If assumed speed is below true speed, alerts will be late or missed completely • The larger the speed difference (faster vehicles), the higher the likelihood of a problem • Also the most important cases for issuing alerts (driver misperception of closing speed and severe consequences of crash) • If assumed speed is above true speed, false alarms become more likely • Variance of distribution of approaching speeds governs the importance of this
Alert System Design Challenges • Address complexity of SV-POV interactions • Accommodate diversity of driver preferences within one set of alert criteria • Customize to fit differing requirements of diverse intersections • Implement with affordable sensor suite • Tracking individual vehicle positions and speeds, with multiple POVs • Covering center of intersection as well as approach legs
Drivers Vehicle Infrastructure In-vehicle display devices DII manager Traffic Signal Traffic sign. contr. Output Driver Interfaces Traffic sign. manag. IDS Predictors Gappredictor Stoppredictor Conflictpredictor Future State Future State Predictor State map State Map Generator • Inputs • Infrastructure state information (e.g. intersection type, signal state, etc); • Vehicles state information (e.g. speed, position, etc); In-vehicle sensors Infrastructure based sensors Signal controller
Cooperative System Opportunities • Data from vehicles to intersection to improve IDS operation: • Longer-range (earlier) information • Acceleration to improve threat estimate • More accurate approach speed information • Enhanced weather or road surface status • Data from intersection to vehicles: • IDS alert status for in-vehicle display • Information about approaching vehicle threats not visible to vehicle sensors • Enhanced weather or road surface status
Cooperative System Development Activities • Define message sets needed for IDS applications, leaving flexibility for alternative implementations • Infrastructure-centered intelligence • Vehicle-centered intelligence • Lane – level accuracy maps • Communication protocol design • Test wireless communication of these message sets using 802.11a and DSRC test kits • Fusion of intersection and vehicle sensor data
Communication Needs Summary • Vehicle broadcast message set per current SAE work, 42 byte payload and 70 byte overhead • Assume (order of magnitude) 100 ms update interval • Range of 300 m for higher-speed rural and 150 m for lower-speed urban environments • Jam density could approach 600 vehicles within intersection range • Accommodating 600 vehicles within DSRC safety channel (3 -- 27 Mbps) requires coordination in MAC protocol