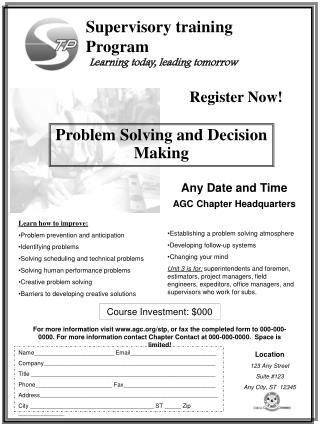
PROBLEM SOLVING & DECISION MAKING
PROBLEM SOLVING & DECISION MAKING. Learning Objectives. At the end of the training, participants are expected to : Understand how to use an innovative yet structured process-based problem solving approach in practical scenarios. Recognize how to take informed decisions and calculated risks.

PROBLEM SOLVING & DECISION MAKING
E N D
Presentation Transcript
Learning Objectives • At the end of the training, participants are expected to: • Understand how to use an innovative yet structured process-based problem solving approach in practical scenarios. • Recognize how to take informed decisions and calculated risks.
Module 3 Problem solving & decision making
“ There are no big problems, there are just a lot of little problems ” - Henry Ford
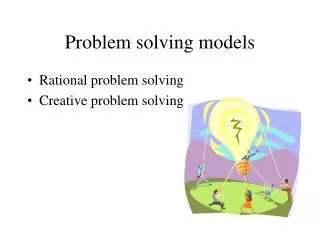
Section1 Problem solving models/ methodologies
What is problem solving? • Problem solving is a higher order thinking process aimed at improving performance or solving impending problems in any aspect of life. • It requires the modulation and control of more routine or fundamental skills with structured thinking and strong effort from a committed group Service Delivery Team Middle Management Project Sponsor Process Group Team Support Team
What is problem solving? • Problem solving is often misunderstood • Issues are confused as problems and problems are confused as causes Issue Problem Cause • Terminology is very critical before looking into the methods of problem solving
Problem Solving Terminology Issue Proposal to solve a problem Cause What brings about a problem Situation What a circumstance is Purpose What we want to do or what we want to be Problem Some portions of a situation that cannot realize purpose Problem Process with set of actions to attain the purpose / aim Solving Identifying the appropriate solution / problem solving calls for strong thinking pattern
Team Building Your Thoughts…..
Thinking patterns STRATEGIC THINKING Judging based on whether a situation is focused or not… remember Strategy is not necessarily strategic EMOTIONAL THINKING Judging based on the participants REALISTIC THINKING Starts from what one can do and fix the essential problems first EMPIRICAL THINKING Judging based on previous experience
Thinking patterns SYSTEMS THINKING Scientific problem solving approach utilizing system concept Purpose Result Outside cause Inside cause Output Input Function System based problem solving process
Systems Thinking • Systems thinking brings structure into the problem solving approach • It is based on system concept • Clearly defines components and the boundaries of each one of them. • Major components • Purpose • Input • Output • Function • Causes (Inside / Outside) • Result
8D Methodology • Structured problem solving approach • Mainly applicable to product / process improvement through correction / elimination of problems • Applies 8 timeless principles to solve problems • Based on using a team approach rather than focusing on individuals
8D Methodology Form Team 1 Describe problem 2 Implement and Verify Interim actions 3 Containment Y N Is it root cause? Identify potential causes Select likely causes Identify possible solution 4 Verify Corrective action 5 6 Implement it Prevent recurrence 7 Congratulate team 8
TRIZ Methodology • Strong creative problem solving methodology • Follows a systematic approach to solve problems against other Sisyphean tasks • Always strives for ideal solutions by avoiding any compromises common with other methods • Major advantage is its ability to by-pass / eliminate contradictions of the system by refusing trade-offs
TRIZ Methodology The Search for solution
Hybrid PSDM Methodology • Using the best practices from all these methods problem solving and decision making can be carved out as a simple “SOLVE” methodology • Similar to the DMAIC approach of SIX SIGMA SPECIFY OBSERVE & MEASURE ANALYZE VERIFY & CHOOSE EXECUTE & EVALUATE
“A problem well stated is a problem half solved” - John Dewey
Problem Framing • Break problems apart in a hierarchical form using a logic tree • Start at 20,000 ft view and move progressively downward • Logic tree diagrams can be drawn from a functional perspective (sales / research / accounting / operations) or from existing problem perspective • Create and follow a structure for problem solving • Structure helps in gripping the issues rapidly • M.E.C.E (MUTUALLY EXCLUSIVE & COMPLETELY EXHAUSTIVE) • Do not try to reinvent the wheel
Identify Business Needs - SPECIFY • Business Needs • No needs… No problems !!! • So identify business needs … • Business needs can usually be in several forms • People Competency • Market / Customer • Financial • Operational
Problem Statement Example During FY 2005, the 1st Time Call Resolution Efficiency for New Customer Hardware Setup was 89% . This represents a gap of 8% from the targets @ 97% that amounts to US $2,000,000 of annualized cost impact.
Problem Statement Template Fill in the Blanks for Your Project: During ___________________________________ , the ____________________ for (Period of time for baseline performance) (Primary business measure) ________________________ was _________________ . (A key business process) (Baseline performance) This gap of ____________________________ (Business objective target vs. baseline) from ___________________ represents ____________________ of cost impact. (Business objective) (Cost impact of gap)
OBSERVE & MEASURE – Data Gathering Data Quantitative Qualitative • Data gathering throws awide avenue for improvement in Organizations • It is neither easy nor fun. But it can be made simple and painless
Data Gathering – Major Techniques Data Quantitative Qualitative • Tally Sheets • Check Sheets • Quality Function Deployment • Research • Brainstorming • Research • Interviewing • Surveys • Affinity Diagram
Select group of people with background in the process area Create the right mix in the group Solicit for ideas and moderate the discussion No idea is a bad idea Participate. Be Creative. Encourage wild and exaggerated ideas No criticisms allowed Data Gathering – Qualitative
Remember… No idea is a bad idea Participate Be Creative. Encourage wild and exaggerated ideas No criticisms allowed Quantity counts more than quality at this stage Build on the ideas provided by others Evaluate ideas only at the end of the session Data Gathering – Qualitative
Data Gathering – Qualitative • Interviewing Tips • Be prepared • Interview in pairs • LISTEN Don’t Lead • Use indirect approach • Don’t ask for too much Emphasize on preparation and courtesy
Interpreting Results • Critical step where we prove or disprove the proposed hypothesis • Interpretation of analysis is of two types • 1. Understanding the data and piece it together • 2. Assembling these findings into an externally directed end-product • This represents the course of action for the Organization • There are a number of analysis tools to choose from to interpret the data • It is critical to choose the solution that fits the particular problem
Common Analyses for Interpretation Analysis Quantitative Qualitative • Pareto Chart • Check Sheets • Cost of Quality • Control Chart • Cause & Effect Diagram • Affinity Diagram • Flowchart • Prioritization Matrix
ANALYZE – Cause & Effect Diagram • Commonly called Fishbone diagram (due to its appearance) or Ishikawa Diagram • Extremely useful in organizing and systematically summarizing results and causes Cause IV Cause V Effect Cause II Cause I Cause III
Cause & Effect Diagram – Why? • Need to study a problem/issue to determine the root cause • Want to study all the possible reasons why a process is beginning to have difficulties, problems, or breakdowns • Need to identify areas for data collection • Want to study why a process is not performing properly or producing the desired results
Cause & Effect Diagram – How? Clearly identify and define the problem, symptom, or effect for which the causes must be identified. Place the problem or symptom being explored at the right, enclosed in a box. Draw the central spine as a thick line pointing to it from the left. Brainstorm to identify the "major categories" of possible causes (not less than 2 and normally not more than 6 or 7). If other applicable data such as check sheets are present, incorporate them as well.
Major Categories Methods Machine Man Variation Measurement System Materials Mother Nature
Cause & Effect Diagram – How? Place each of the identified "major categories" of causes in a box or on the diagram and connect it to the central spine by a line Within each "major category" ask, "Why does this condition exist?" Continue to add clauses to each branch until the fishbone is completed. Once all the bones have been completed, identify the likely, actionable Root Cause(s).
Pareto Chart Named after Italian economist Vilfredo Pareto “In any group of elements, a small number of elements determine most of the results.” It is also known as the 80/20 rule e.g., 20% of the causes account for 80% of the problems. Concept ofvital few-trivial many
Pareto Chart • A vertical bar chart where bars represent the components of the total effect or problem • Arranged in descending order according to their contribution to the total • A Pareto Diagram allows data to be displayed as a bar chart and enables the main contributions to a problem to be highlighted.
Constructing a Pareto Chart Determine data classification items Determine the check sheet items and collect data Tabulate data for each classification item Arrange data in ascending or descending order of occurrence frequency Calculate cumulative frequency of occurrence against the causes and plot values a histogram Use frequency on the y-axis and causes on the x-axis
Sample Pareto Chart 100% 90% 80% 70% 60% 50% 40% 30% 20% 10% 0% 200 180 160 140 120 100 80 60 40 20 0 Wrong patient Wrong dc’d Missed dose Wrong medicine Wrong dose Wrong time
Next Steps… • Once the data is interpreted into useful information through appropriate analysis, the next step is to • Present the results to the team / corresponding personnel • Get the buy-in of the team to implement the right solution • This requires clear decision making strategy to be followed by the team • Decision making however is a critical part of every single step in problem solving • Let us look in some detail the process of effective decision making
“The problem is not that there are problems… It is expecting otherwise and thinking that having problems is a problem.” - Theodore Rubin
Section 2 Decision making models/ methodologies
Importance of decision-making 7 Levels ofOrganizational LeadershipMastery Level 7:SeniorExecutiveLeader FiveLeadershipSpecializedSkillAreas(SSAs) Level 6:Group Leader Level 5: Business Leader Level 4: Functional Leader Level 3: Lead Managers Buying & Selling Business Acumen Integrity Communications(Verbal & Non-Verbal) DecisionMaking Interpersonal Relations Level 2: Lead Others Level 1: Lead Self Organizational Leadership Levels (Attitude/Style/Education/Experience) Leadership Competencies
Decision-Making Spectrums (Decision Making Accuracy*) Accurate Inaccurate (Decision Making Time*) Quick Slow/Long *Note: Accuracy is not proportionate/or necessarily related to time.
Problem solving is concerned with overcoming obstacles in the path toward an objective and may or may not require action. A decision is an act requiring judgment that is translated into action. It is more comprehensive than problem solving Decision Making Basics They are interrelated but not interchangeable
The Scope of Decision Making Individual decision making Group decision making Organizational decision making Metaorganizational decision making
The Scope of Decision Making Metaorganization Decisional Inputs (Objectives, information, resources, energy) Organization Interactional Levels Group Individual Decisional Outputs (Actions transactions, outcomes) Permeable Boundaries External Environment
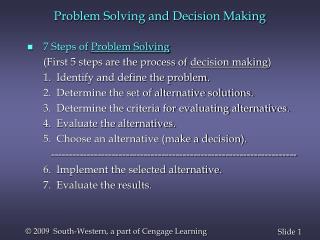
Decision Making Process Compare & analyze alternatives Find alternatives Set objectives Make the choice Follow-up & Control Implement decisions VERIFY AND CHOOSE Revise objectives Renew search Revise / Update objectives Take necessary corrective action EXECUTE AND EVALUATE
Decision Making Process 1 Set Objectives • Objectives constitute the foundation of effective decision making • While making the right decision is the means the objective is the end • Success of the decision making process lies in the measure of attaining the objectives