Download
1 / 32
320 likes | 465 Views
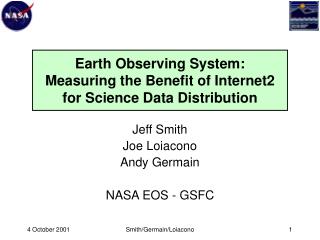
Earth Observing System: Measuring the Benefit of Internet2 for Science Data Distribution. Jeff Smith Joe Loiacono Andy Germain NASA EOS - GSFC. Outline. EOS Overview EOS Program EOS Data and Information System Network Measurements Data Collection Abilene Traffic Loads

E N D
Earth Observing System: Measuring the Benefit of Internet2 for Science Data Distribution Jeff Smith Joe Loiacono Andy Germain NASA EOS - GSFC Smith/Germain/Loiacono
Outline • EOS Overview • EOS Program • EOS Data and Information System • Network Measurements • Data Collection • Abilene Traffic Loads • Abilene Utilization • Server Statistics • Active Testing • Future Plans Smith/Germain/Loiacono
EOS Overview The Earth Observing System (EOS) is the centerpiece of NASA's Earth Science Enterprise (ESE). It consists of a science component and a data system supporting a coordinated series of polar-orbiting and low inclination satellites for long-term global observations of the land surface, biosphere, solid Earth, atmosphere, and oceans. By enabling improved understanding of the Earth as an integrated system, the EOS program has benefits for us all. The EOS Project Science Office (EOSPSO) is committed to helping bring program information and resources to program scientists and the general public alike. Smith/Germain/Loiacono
Current and Upcoming EOS Missions • Terra Mission - launched December 1999 • The Terra (formerly AM-1) satellite is the flagship of NASA's ESE (Earth Science Enterprise). Terra is the first EOS platform and provides global data on the state of the atmosphere, land, and oceans, as well as their interactions with solar radiation and with one another. • Aqua Mission - rescheduled: early 2002 • Aqua will collect climate-related data. Its on-board sensors will measure clouds, precipitation, atmospheric temperature/moisture content, terrestrial snow, sea ice, and sea surface temperature during its six-year mission. Flying in low-earth orbit, Aqua will pass over the equator at the same time each afternoon, allowing the comprehensive measurements needed to assess long-term change. • Aura ICEsat Mission - scheduled: July, 2003 • The EOS - Chemistry satellite hosts a suite of scientific instruments designed to make the most comprehensive measurements ever undertaken of atmospheric trace gases. Its objective is to study the chemistry and dynamics of the Earth's atmosphere with emphasis on the upper troposphere and lower stratosphere (0-30km). The mission will measure ozone, aerosols, and several key atmospheric constituents that play an important role in atmospheric chemistry, air quality, and climate. Smith/Germain/Loiacono
EOS Missions Smith/Germain/Loiacono
EOS Platforms, Instruments, and Science Objectives Smith/Germain/Loiacono
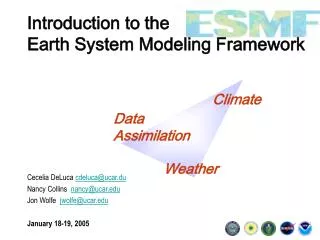
EOSDIS - EOS Data Infrastructure The EOS Data and Information System (EOSDIS) is designed to operate the satellites and instruments, capture the satellite data, generate useful Earth science data products, and make the products available to users in the U.S. and throughout the world. The two major parts of EOSDIS are Mission System and Science System. The Mission System commands and controls EOS spacecraft and instruments, monitors their health and safety, and performs mission planning and scheduling, initial data capture, and initial data processing. The Science System generates higher level data products suitable for analysis by NASA principal investigators and the general scientific community. Smith/Germain/Loiacono
EOSDIS Enterprise NASA EOS Satellites and Instruments ESSnet Distributed Active Archive Centers E x t e r n a l C o m m u n i c a t i o n s EMSnet Investigators ASF E O S D I S C o m m u i c a t i o n s E D O S EBnet Value Added Providers EDC Other NASA Satellites with EOS Instruments GSFC Instrument Support Terminals JPL ESA Satellites with EOS Instruments Science Computing Facilities LaRC NSIDC External Data Users NASDA Satellites with EOS Instruments ORNL Science Computing Facilities Smith/Germain/Loiacono
EOSDIS Network Architecture vBNS+ Chi Mid-Atlantic Crossroads NISN Smith/Germain/Loiacono
Data Product Levels • Raw Telemetry - as transmitted from spacecraft • Instruments multiplexed, CCSDS frames • Level 0: Instrument telemetry • Time stamped, Reed-Solomon decoded, fill data, etc. • Level 1: Instrument Measurements • Calibrated, georeferenced • Level 2: Scientific Parameter Retrieval • Inferred geophysical properties • Corresponding to individual instrument measurements • Level 3: Gridded • Interpolated / extrapolated to useful space/time coordinates • Level 4: Integrated • E.g., Multiple instruments, movie loops Smith/Germain/Loiacono
LaRC EOS 9-1-01 NET DAAC QA SCF
Data Collection Overview • Data Collected • Traffic loads on key interfaces • Traffic volumes overall • Traffic volumes to sites • Traffic per host (sender & receivers - not included) • Traffic characteristics (ports, types - not included) • Purposes • Historical data and trends vs. requirements • Planning • Troubleshooting • Security • Who’s doing what to whom on the EOS network Smith/Germain/Loiacono
Abilene Traffic Loads GSFC DAAC Router interface to Abilene - Science data product transfers from GSFC to Principal investigator sites located at Abilene member universities continues to grow. - Note: Traffic loading on other key interfaces is not included in presentation Smith/Germain/Loiacono
Utilization Data Collection Process NetFlow Collector: cflowd EOS Performance Web-site GSFC Greenbelt, MD EROS Data Center Sioux Falls, SD ARTS reports and Custom Scripts LARC Langley, VA NSIDC Colorado Springs, CO - Cisco NetFlow data is sent from EOS routers at above locations to ‘cflowd’ collector at GSFC every few seconds throughout the day. ARTS and custom scripts are run automatically every night producing web-based reports. Data is compressed and archived every week. * ‘cflowd’ and ARTS software is maintained by CAIDA. Smith/Germain/Loiacono
Abilene Science Data Utilization Daily Quantities of EOS Science Data to Abilene Partners - EOS use of Abilene for science data product transfers from GSFC to Abilene partner institutions is significant Smith/Germain/Loiacono
Top Users of Traffic to Abilene Top EOS Partner Institutions using Abilene - Custom scripts that interpret Cisco’s NetFlow data keep track of major EOS Partners using Abilene to efficiently retrieve data from GSFC Smith/Germain/Loiacono
Utilization for Single Abilene Site EOS Science data products delivered to U. Miami over Abilene - University researchers use Abilene for efficient retrieval of large science data sets. U Miami is largest single EOS partner institution using Abilene to retrieve science data products from GSFC, often extracting over 50 Gigabytes daily Smith/Germain/Loiacono
Abilene Daily Report Abilene Statistics for router: GSFC This Abilene Flow Distribution Report was generated at 09/04/2001 06:15:00 for Router: gsfc Total Bytes to Abilene : 173,127,413,068 Pct.: 99 Total Bytes to NSI Router: 670,153,399 Pct.: 0 Organization Name Network Science Bytes Pct. Test Bytes PI Total University of Miami 129.171.0.0 122,163,427,632 96 2,098,222,247 124,261,649,879 University of Wisconsin 144.92.0.0 2,543,093,993 2 187,598,416 2,730,692,409 Oregon State University 128.193.0.0 2,157,704,001 2 1,779,053,008 3,936,757,009 NCAR 128.117.0.0 131,818,168 0 4,936,226,700 5,068,044,868 ECS (2) 192.107.195.0 5,145,462 0 5,145,462 University of Alaska 137.229.0.0 3,497,758 0 3,497,758 NASDA 133.56.0.0 2,447,226 0 2,447,226 University of Maryland (2) 128.8.0.0 1,783,506 0 6,000 1,789,506 ECS 198.118.203.0 1,667,795 0 5,880 1,673,675 University of Arizona 128.196.0.0 1,627,629 0 4,208,195,612 4,209,823,241 JPL 137.78.0.0 1,121,335 0 2,604,571,172 2,605,692,507 UC Santa Barbara (2) 128.111.0.0 1,071,281 0 787,782,556 788,853,837 University of Montana 150.131.0.0 1,070,530 0 525,665,836 526,736,366 University College (SCF) 128.40.25.0 938,880 0 357,299,280 358,238,160 Ohio State University 128.146.0.0 805,896 0 620,255,536 621,061,432 Boston University 128.197.75.0 746,384 0 7,031,575,652 7,032,322,036 ECS (3) 192.102.216.0 391,139 0 391,139 University of Alabama (UAH) 198.116.0.0 215,336 0 215,336 UMBC 130.85.0.0 115,441 0 115,441 University of Colorado 128.138.0.0 4,123 0 4,123 UC Berkeley 128.32.0.0 398 0 398 University of Hawaii 128.171.0.0 286 0 286 University of Delaware 128.175.0.0 72 0 72 Total PI data flows (see above) 127,018,694,271 90 25,136,457,895 152,155,152,166 Non-PI data flows (various) 13,363,794,346 9 7,608,466,556 20,972,260,902 Total Abilene bytes 140,382,488,617 100 32,744,924,451 173,127,413,068 PI Bytes as pct. of total (Abilene and NSI) 127,018,694,271 90 Smith/Germain/Loiacono
Customized ARTS Network Report • Network Statistics for router: GSFC • router: 192.43.240.53 • ifIndex: User Network (Fddi1/0/0 198.xxx.yyy.65) • period: 09/25/2001 19:58:57 - 09/26/2001 19:58:41 EDT • Src Network Pkts Bytes Destination • ------------------ -------------- -------------- ----------------------------------------------------------- • 198.xxx.yyy.64/27 36601161 54863498565 198.116.57.0/24 -- NSI Netblock • 198.xxx.yyy.64/27 33690523 50462935052 129.171.96.0/19 -- University of Miami (NET-MIAMI) • 198.xxx.yyy.64/27 21579829 31970765873 128.149.0.0/16 -- NASA Headquarters (NET-JPL-NET) • 198.xxx.yyy.64/27 9995871 14983779816 129.171.97.106/32 -- miracle.rsmas.miami.edu -- University of Miami (NET-MIAMI) • 198.xxx.yyy.64/27 8920265 12661046304 192.67.108.0/24 -- National Aeronautics and Space Administration (NETBLK-NASA-CN • 198.xxx.yyy.64/27 3921594 5846242247 128.183.0.0/16 -- NASA Goddard Space Flight Center (NET-GSFC) • 198.xxx.yyy.64/27 2467372 3690544592 129.116.0.0/16 -- University of Texas (NET-CHPCHYPERHOSE) • 198.xxx.yyy.64/27 2428576 3630351822 132.239.0.0/16 -- University of California, San Diego (NET-UCSD-SUBNETS) • 198.xxx.yyy.64/27 2345597 3500985134 128.197.0.0/16 -- Boston University (NET-BU-NET) • 198.xxx.yyy.64/27 2219596 3307136570 137.78.0.0/16 -- Jet Propulsion Laboratory (NET-JPL-NET2) • 198.xxx.yyy.64/27 2201514 3290519498 128.117.0.0/16 -- National Center for Atmospheric Research (NET-UCAR) • 198.xxx.yyy.64/27 1851848 2766130262 128.196.0.0/16 -- University of Arizona (NET-UNIV-ARIZ) • 198.xxx.yyy.64/27 1376872 2065165027 128.111.100.207/32 -- taichi.icess.ucsb.edu -- University of California, Santa ) • 198.xxx.yyy.64/27 1349216 2004394808 144.92.0.0/16 -- MACC (NET-UWMSN-NET) • 198.xxx.yyy.64/27 1071927 1607363478 138.194.0.0/16 -- CSIRO IT Services (NET-CSIRO-CLAYTON) • 198.xxx.yyy.64/27 963529 1445049266 128.49.0.0/16 -- Naval Ocean Systems Center (NET-NOSC-ETHER) • 198.xxx.yyy.64/27 949036 1423408199 128.110.0.0/16 -- University of Utah (NET-UTAH-NET) • 198.xxx.yyy.64/27 934161 1388544068 128.193.0.0/16 -- Oregon State University (NET-ORST) • 198.xxx.yyy.64/27 876516 1303285172 128.111.0.0/16 -- University of California, Santa Barbara (NET-UCSB) • 198.xxx.yyy.64/27 617633 876607883 192.67.108.14/32 -- matrix4.nsstc.uah.edu -- National Aeronautics and Space • 198.xxx.yyy.64/27 659790 730631285 192.107.190.0/24 -- NASA Ames Research Center (NET-EOS-DAAC-NET2) • 198.xxx.yyy.64/27 474613 700318390 198.118.203.0/24 -- NSI Netblock • 198.xxx.yyy.64/27 312384 468120358 128.138.0.0/16 -- University of Colorado (NET-COLORADO) • 198.xxx.yyy.64/27 258856 376589356 128.40.0.0/16 -- University College London (NET-UCL-NET-A) • 198.xxx.yyy.64/27 198689 297880544 216.17.192.50/32 -- 216.17.192.50 -- Front Range Internet, Inc. (NETBLK-NET-RII- • 198.xxx.yyy.64/27 199406 288131072 128.146.0.0/16 -- Ohio State University (NET-OHIO-STATE) Smith/Germain/Loiacono
Sample from Custom Flow Report • Detailed Flow Data for External Destinations • Source Port Bytes Destination • ------------------------------------------------------------------------------------------------- • 198.xxx.yyy.147 389D 2930 memberdir.netscape.com -- Netscape Communications Corp. (NETBLK- • 198.xxx.yyy.148 80D 91401 (web requests out) • 198.xxx.yyy.149 443D 6012 (secure web in) • 198.xxx.yyy.149 80D 848446 (web requests out) • 198.xxx.yyy.151 443D 67601 (secure web in) • 198.xxx.yyy.151 80D 608132 (web requests out) • 198.xxx.yyy.153 21D 2382 (ftp control out) • 198.xxx.yyy.153 20D 137368 (ftp sent out) • 198.xxx.yyy.153 80D 3984705 (web requests out) • 198.xxx.yyy.153 137D 1872 128.161.3.12 -- NASA Ames Research Center (NET-NSN-NET) • 198.xxx.yyy.153 137D 1872 128.161.7.33 -- NASA Ames Research Center (NET-NSN-NET) • 198.xxx.yyy.153 0D 720 polaris.umuc.edu -- University of Maryland University College • 198.xxx.yyy.153 2048D 22500 polaris.umuc.edu -- University of Maryland University College • 198.xxx.yyy.153 22D 352 polaris.umuc.edu -- University of Maryland University College • 198.xxx.yyy.153 2048D 912 www.cisco.com -- Cisco Systems, Inc. (NET-SWLAB1) • 198.xxx.yyy.153 2048D 1794 u1.abs.net -- ABSnet Internet Services, Inc. (NETBLK-ABS-NET- • 198.xxx.yyy.153 110D 1931 mail1.abs.net -- ABSnet Internet Services, Inc. (NETBLK-ABS-NET- • 198.xxx.yyy.153 1259D 13364 idyle.com -- Cable & Wireless USA (NETBLK-CW-10BLK) CW-10BLK • 198.xxx.yyy.153 1975D 4066 aim1.radiate.com -- Abovenet Communications, Inc. (NETBLK- • 198.xxx.yyy.153 137D 234 so-4-1-0.mp2.Washington1.Level3.net -- Level 3 Communications, • 198.xxx.yyy.153 2048D 5148 p2.my.vip.snv.yahoo.com -- GeoCities (NETBLK-NETBLK-GEO-1) • 198.xxx.yyy.153 2786D 252444 ns1.solarwinds.net -- Southwestern Bell Internet Services • 198.xxx.yyy.153 137D 468 so-2-0-0.mp2.SanJose1.Level3.net -- Level 3 Communications, Inc. • 198.xxx.yyy.153 137D 468 gigabitethernet9-0.ipcolo1.SanJose1.Level3.net -- Level 3 • 198.xxx.yyy.154 80D 182348 (web requests out) • 198.xxx.yyy.156 23D 176 polaris.umuc.edu -- University of Maryland University College • 198.xxx.yyy.156 110D 9151 eos.east.hitc.com -- Performance Systems International (NET- Smith/Germain/Loiacono
Server Statistics • http://m0mss01.ecs.nasa.gov/smc/vrdash/ Smith/Germain/Loiacono
Active Testing Overview • End-to-end user level test • “Active” testing • little or no visibility into network internals • Purposes • EOS: assess whether networks as implemented meet EOS requirements • CEOS: assess whether networks can support intended applications • Resolve user complaints: • Network problems -- or somewhere else?? • Determine bottlenecks -- seek routing alternatives • Provide a basis for allocation of additional resources Smith/Germain/Loiacono
Active Testing - Process • Test script runs hourly to each site: • Traceroute (1 way) • Number of hops -- route stability --> Hops Chart • Pings • 100 pings prior to thruput test or 100/300 during • Round Trip Time --> RTT Chart • Packet Loss --> Packet Loss Chart • TCP Throughput • TCPwatch, Iperf, or FTP --> Thruput Chart • requires cooperating client at destination • TCPwatch / Iperf keeps send buffer full for 30 Seconds • Netstat -> packets retransmitted (if pings blocked) Smith/Germain/Loiacono
US Active Test Sites ASF Wash Toronto CCRS Mont BU ORST Mich Wisc Niagara SUNY-SB EDC Ohio Colo St. Chicago GSFC UMD RSS NOAA SLAC UVA GPN NCAR NSIDC LaRC NGDC, NOAA UCSB JPL LANL Ariz MSFC, NSSTC UCSD NMEX Texas Key: USF EOS DAAC Miami NASA Nodes SCFs QA Other Other Nodes Smith/Germain/Loiacono
On line results • Updated Daily • http://corn.eos.nasa.gov/networks • "Network Health Statistics" • GSFC Sites • EOS Sites • EMSNet Sites • CEOS Sites • Other sites • Charts: All sources to specified destination • Thruput, RTT, Packet Loss, Hop Count • Weekly: 24 measurements per day from each source • 60 day: Daily Average • Yearly (RSN) Smith/Germain/Loiacono
Sample Chart: BU Thruput (current week) Smith/Germain/Loiacono
Sample Chart: BU RTT, Loss (current week) Smith/Germain/Loiacono
Sample Chart: BU Thruput (2 months) Smith/Germain/Loiacono
Sample Chart: UCSD Thruput (current week) Smith/Germain/Loiacono
Sample Chart: UCSD Thruput (2 months) Smith/Germain/Loiacono
Thruput Range: GSFC to Abilene Sites FL, Univ. of Miami OH, Ohio State Univ CA, UCSD - SIO MT, Univ of Montana CO, Colo State Univ CO, NCAR - Boulder TX, U Texas - Austin AZ, Tucson (U of AZ) VA, UVA OR, Oregon State Univ. MA, Boston Univ MD, UMD- College Park NY, SUNY Stony Brook CA, UCSB 100 Maximum 10 Mbps Median 1 Minimum 0 . 1
POCs • Jeff Smith Jeff.Smith@gsfc.nasa.gov 301-614-5038 • Joe Loiacono jloiacon@nastg.gsfc.nasa.gov 301-794-2509 • Andy Germain Andy.Germain@gsfc.nasa.gov 301-902-4352 Smith/Germain/Loiacono