Graphing Exponential Functions
This guide provides a comprehensive overview of graphing exponential functions by hand, focusing on key properties such as input-output pairs and the base multiplier property. It illustrates how to identify whether a function is increasing or decreasing based on the value of the base (b) and how to find intercepts of the function. Additionally, it includes practical examples and tips for using graphing calculators to verify results, making it an invaluable resource for students tackling exponential functions.

Graphing Exponential Functions
E N D
Presentation Transcript
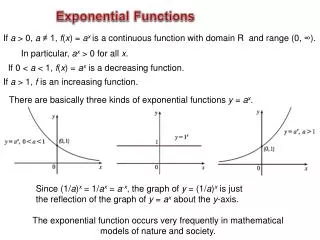
Section 4.3 Graphing Exponential Functions
Example Graph by hand. Solution • List input–output pairs (see table) • Input increases by 1 and output multiplies by 2 • Plot these points (see next slide) Section 4.3 Slide 2 Graphing Exponential Functions with b > 1 Graphing Exponential Functions
Solution Continued • Use graphing calculator to verify Section 4.3 Slide 3 Graphing Exponential Functions with b > 1 Graphing Exponential Functions
Example Graph by hand. Solution • List input–output pairs (see table) • For example • (–1, 8) is a solution • x increases by 1, y is multiplied by ½ Section 4.3 Slide 4 Graphing Exponential Functions with 0< b < 1 Graphing Exponential Functions
Solution Continued Section 4.3 Slide 5 Graphing Exponential Functions with 0< b < 1 Graphing Exponential Functions
Property For an exponential function of the form y = abx, if the value of the independent variable increases by 1, the value of the dependent variable is multiplied by b. For the function , as the value of x increases by 1, the value of y is multiplied by 3 For the function , as the value of x increases by 1, the value of y is multiplied by 3/4 Illustration Section 4.3 Slide 6 Base Multiplier Property; Increase or Decreasing Property Base Multiplier Property
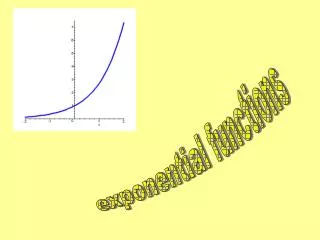
Property Let , where a > 0. Then If b > 1, then the function f is increasing. We say that the function grows exponentially (left). If 0 < b < 1, then the function f is decreasing. We say that the function decays exponentially (right). Section 4.3 Slide 7 Increase or Decrease Property Base Multiplier Property
Property For an exponential function of the form the y-intercept is (0, a). The function , the y-intercept is (0, 5) The function , the y-intercept is (0, 4) Illustration Section 4.3 Slide 8 Y-intercept of an Exponential Function Intercepts
Warning Exponential function of the form , the y-intercept is not (0, b). By writing , we see that the y-intercept is (0, 1). For example, for , the y-intercept is (0, 1). Let 1. Find the y-intercept of f. Example Section 4.3 Slide 9 Intercepts and Graph of an Exponential Function Intercepts
Solution is of the form , We know that the y-intercept is (0, a), or (0, 6). 2. Find the x-intercept of f. By base multiplier property, x increases by 1, y value multiplies by ½ Example Solution Section 4.3 Slide 10 Intercepts and Graph of an Exponential Function Intercepts
Solution Continued No number of halvings will result in zero As x grows large, y gets closer to the x-axis Called horizontal asymptote 3. Graph f by hand. Example Section 4.3 Slide 11 Intercepts and Graph of an Exponential Function Intercepts
Solution Plot solutions from the table • Verify on graphing calculator Section 4.3 Slide 12 Intercepts and Graph of an Exponential Function Intercepts
Example • The graph of an exponential function f is shown. • Find f(2). • Blue arrow shows input of x = 2 leads to an output y = 8 • f(2) = 8 Solution Section 4.3 Slide 13 Finding Values of a Function from Its Graph Reflection Property
Example • 2. Find x when f(x) = 2. • Red arrow shows output of y = –2 leads to an input x = 2 • x = –2 when f(x) = 2 Solution Section 4.3 Slide 14 Finding Values of a Function from Its Graph Reflection Property
Example • 3. Find x when f(x) = 0. • Graphs of exponential functions get close to zero, but never reaches x-axis • No value of x where f(x) = 0 Solution Section 4.3 Slide 15 Finding Values of a Function from Its Graph Reflection Property