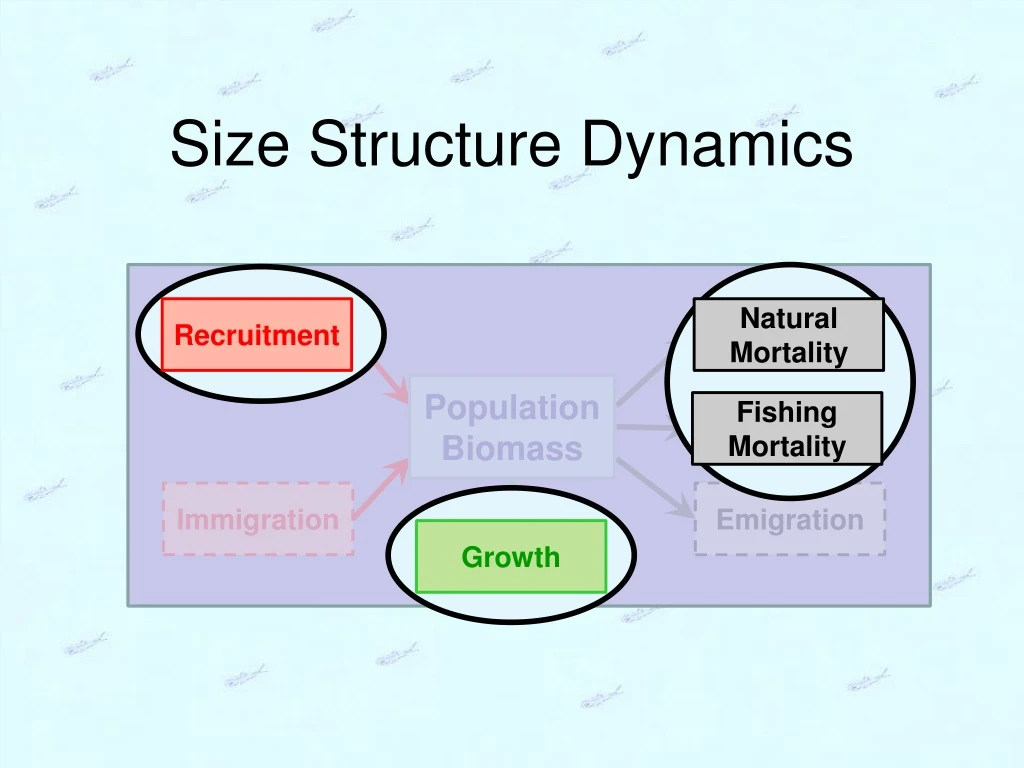

Size Structure Dynamics
E N D
Presentation Transcript
Size Structure Dynamics Recruitment Natural Mortality Population Biomass Fishing Mortality Immigration Emigration Growth
Size Structure Methods • Length frequencies • Proportional Size Distribution (PSD) • was “Proportional Stock Density” • Proportional Size Distribution (PSD-X) • was “Relative Stock Density” Size Structure
Length Frequency • Use “common” breaks depending on fish size and sample size • 2, 5, 10, or 25 mm • 0.1, 0.25,0.5,or 1 in Size Structure
Size Structure Concept Recruitmentcontrols … numbers in smaller length bins. Growthcontrols … fish “moving” into larger length bins. Fishing mortality controls … fish removal from larger length bins. Natural mortality controls … fish removal from smaller length bins and, without compensatory mortality, larger length bins. Natural Mortality Natural Mortality Thus, size structure analysis provides insight on many aspects of population dynamics! Frequency Recruitment Growth Fishing Mortality 5 10 15 20 25 Length Size Structure
Length Frequency -- Example From Stone and Lott. 2002. North American Journal of Fisheries Management 22:975–984 Size Structure
Length Frequency -- Example From Paukert and Willis. 2001. Fisheries Management and Ecology 8:533-542 Size Structure
Length Frequency in R • Whittlesey Creek Case Study Size Structure
Why fewer 6” than 10” fish? Size structure summaries are heavily influenced by the relative selectivity of the gear used. Frequency 5 10 15 20 25 Length Size Structure
Gillnet -- Selectivity • Total selectivity is related to three parts of catch process • encounter • contact • retention from Anderson, C.S. 1998. Partitioning total size selectivity of gill nets for walleye (Stizostedionvitreum) into encounter, contact, and retention components. Can. J. Fish. Aquat. Sci. 55: 1854–1863. Size Structure
Case Study • Size Structure Gear Bias Case Study Size Structure
Size Structure Methods • Length frequencies • Proportional Size Distribution (PSD) • Proportional Size Distribution (PSD-X) Size Structure
Proportional Size Distribution (PSD) • Stock length • mature length; fully vulnerable length; or minimum size acceptable to anglers. • Quality length • minimum size anglers like to harvest. Size Structure
PSD Stock (37) Quality (17) Preferred (5) 17 = 0.46 PSD = 37 5 PSD-PQ = = 0.29 17
PSD Size Structure
100 80 60 Number of LMB 40 20 0 5 10 15 20 Total Length (inches) PSD Quality 253 = 0.327 Stock 773 8 12 Size Structure
PSD -- Example From Stone and Lott. 2002. North American Journal of Fisheries Management 22:975–984 Size Structure
PSD -- Example From Paukert et al. 2002. North American Journal of Fisheries Management 22:86–95. Size Structure
PSD -- Example From Pierce et al. 2003. North American Journal of Fisheries Management 23:331–339. Size Structure
Size Structure Methods • Length frequencies • Proportional Size Distribution (PSD) • Proportional Size Distribution (PSD-X) Size Structure
Size Structure – Summary Measure • Proportional Size Distribution (PSD): • Examples • PSD-P numerator is “preferred” fish. • PSD-15 numerator is >15 fish. Size Structure
PSD – Interpretation • Many authors suggest that values of 40-60 or 30-70 represent “balanced” populations. • May depend on management goals. Size Structure
Size Structure – Interpretation • To strengthen conclusions of PSD analysis: • Evaluate condition, growth, and mortality of target species and other species. • Determine if PSD, condition, growth, and mortality of all species are consistent with a single interpretation. • Evaluate PSD of other prey or predator species in the fish community. Size Structure
Size Structure – Interpreting PSD 100 80 60 (lmb,bg) Prey PSD 40 20 (wae,yep) 0 0 20 40 60 80 100 Predator PSD Size Structure