
Multiple regression
E N D
Presentation Transcript
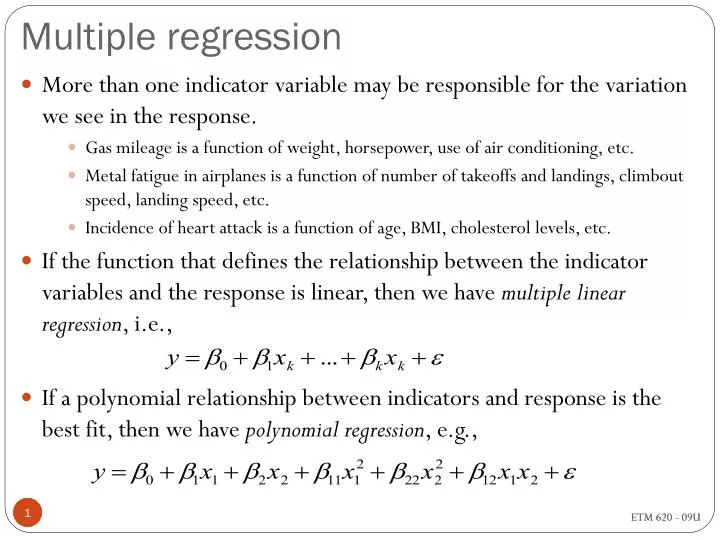
Multiple regression • More than one indicator variable may be responsible for the variation we see in the response. • Gas mileage is a function of weight, horsepower, use of air conditioning, etc. • Metal fatigue in airplanes is a function of number of takeoffs and landings, climbout speed, landing speed, etc. • Incidence of heart attack is a function of age, BMI, cholesterol levels, etc. • If the function that defines the relationship between the indicator variables and the response is linear, then we have multiple linear regression, i.e., • If a polynomial relationship between indicators and response is the best fit, then we have polynomial regression, e.g., 1 ETM 620 - 09U
Multiple linear regression: Matrix approach • The viscosity of slurry is believed to be a function of the temperature and the feed rate. A number of readings were taken with the following results: Hypothesize the relationship, Y = β0 + β1 x1 + β2 x2 + ε and calculate the estimate, 2 ETM 620 - 09U
Matrix form of the equation • Define the matrices: 3 ETM 620 - 09U
General Matrix Form • We obtain the least squares estimates (b0, b1, b2) of (β0, β1, β2) by solving the matrix equation: for b, or 4 ETM 620 - 09U
From Excel, XTX = (XTX)-1 = XTY = b =
How do we interpret these results? R2– the degree to which the variability of the data is accounted for in the model will naturally increase as number of regressor variables increases adjusted R2– adjusted to reflect how well the addition of new regressors improves the ability of the model to account for the variability in the data. adjusted R2 > R2if the new term significantly decreases MSE adjusted R2 << R2 if the new term is not significant In our example, R2 = _______________ ; adj R2 = ________________ Interpretation?
Confidence intervals around β values … Calculated by, Given in the regression results … Interpretation?
A trickier example… The gas mileage for a passenger automobile is believed to be a function of the weight of the car and the horsepower of the engine. Several cars were tested with the following results: 9 ETM 620 - 09U
Let’s try it in Minitab … What do the residuals look like? What does the output of the regression tell us? What do we get if we try “Stepwise Regression”?
Polynomial regression … Example: The expected yield of a crop of marigolds is hypothesized to be a function of the days after the first bloom. Yield (in number of blooms) from a given plot was counted in one growing season with the results as given in the data file. Step 1: plot the data …
Fitting the polynomial … Hypothesize the model, In Excel, In Minitab,
Indicator variables Allows us to include qualitative factors in regression analysis … machine type grade of fuel operator Example, In addition to SAT scores, an admissions officer is concerned that whether or not a student attended private high school might affect the freshman GPA. Data from 20 students resulted is given in the data file. Conduct the analysis and interpret the results …
Problems in multiple regression Multicollinearity Influential observations Autocorrelation


