Download

1 / 48
480 likes | 569 Views
Explore projections and population data for civilian labor force participation in the U.S. by age and race/ethnicity from 1990 to 2020. Detailed analysis by major age groups and demographic breakdowns.

E N D
Trends in Labor Force Participation in the United States, by Age and Race/Ethnicity from 1990 to 2020 Projections Prepared by the Community Service Council with support from the Metropolitan Human Services Commission DRAFT: May 20, 2013
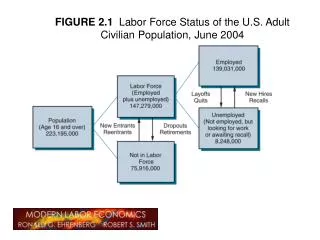
CIVILIAN NONINSTITUTIONAL POPULATION BY AGE Prepared by the Community Service Council, with support from the Metropolitan Human Services Commission (5/20/2013).
Total Civilian Noninstitutional Population by Major Age Groups Source: Toossi, Mitra. “Employment Outlook: 2010-2020: Labor Force Projections to 2020: A More Slowly Growing Workforce,” Monthly Labor Review, January 2012; US Census Bureau, 1990, 2000, 2010 Censuses; US Census Bureau, 2012 National Population Projections. Prepared by the Community Service Council, with support from the Metropolitan Human Services Commission (5/20/2013).
Total Civilian Noninstitutional Population, Percent Distribution by Major Age Groups 38.9% 20.5% 12.9% 11.5% 9.7% 6.5% Source: Toossi, Mitra. “Employment Outlook: 2010-2020: Labor Force Projections to 2020: A More Slowly Growing Workforce,” Monthly Labor Review, January 2012. Prepared by the Community Service Council, with support from the Metropolitan Human Services Commission (5/20/2013).
Total Civilian Noninstitutional Population Age 16 & Older, Percent Distribution by Major Age Groups 48.9% 16.2% 14.5% 12.2% 8.2% Source: Toossi, Mitra. “Employment Outlook: 2010-2020: Labor Force Projections to 2020: A More Slowly Growing Workforce,” Monthly Labor Review, January 2012. Prepared by the Community Service Council, with support from the Metropolitan Human Services Commission (5/20/2013).
CIVILIAN NONINSTITUTIONAL POPULATION BY RACE/ETHNICITY Prepared by the Community Service Council, with support from the Metropolitan Human Services Commission (5/20/2013).
Total Civilian Noninstitutional Population Age 16 & Older by Race/Ethnicity 165,024,000 46,067,000 32,650,000 14,952,000 Source: Toossi, Mitra. “Employment Outlook: 2010-2020: Labor Force Projections to 2020: A More Slowly Growing Workforce,” Monthly Labor Review, January 2012. Prepared by the Community Service Council, with support from the Metropolitan Human Services Commission (5/20/2013).
Total Civilian Noninstitutional Population Age 16 & Older, Percent Distribution by Race/Ethnicity 62.7% 17.5% 12.4% 5.7% Source: Toossi, Mitra. “Employment Outlook: 2010-2020: Labor Force Projections to 2020: A More Slowly Growing Workforce,” Monthly Labor Review, January 2012. Prepared by the Community Service Council, with support from the Metropolitan Human Services Commission (5/20/2013).
Labor force participation Prepared by the Community Service Council, with support from the Metropolitan Human Services Commission (5/20/2013).
LABOR FORCE PARTICIPATION BY AGE Prepared by the Community Service Council, with support from the Metropolitan Human Services Commission (5/20/2013).
Total Civilian Labor Force Participation for Persons 16 & Older 164,360,000 Source: Toossi, Mitra. “Employment Outlook: 2010-2020: Labor Force Projections to 2020: A More Slowly Growing Workforce,” Monthly Labor Review, January 2012. Prepared by the Community Service Council, with support from the Metropolitan Human Services Commission (5/20/2013).
Civilian Labor Force Participation for Persons 16 & Older by Major Age Groups 104,619,000 41,411,000 29,298,000 18,330,000 9,945,000 2,168,000 Source: Toossi, Mitra. “Employment Outlook: 2010-2020: Labor Force Projections to 2020: A More Slowly Growing Workforce,” Monthly Labor Review, January 2012. Prepared by the Community Service Council, with support from the Metropolitan Human Services Commission (5/20/2013).
Civilian Labor Force Participation Rates for Persons 16 & Older by Major Age Groups 81.3% 68.8% 62.5% 48.2% 31.0% 10.0% Source: Toossi, Mitra. “Employment Outlook: 2010-2020: Labor Force Projections to 2020: A More Slowly Growing Workforce,” Monthly Labor Review, January 2012. Prepared by the Community Service Council, with support from the Metropolitan Human Services Commission (5/20/2013).
LABOR FORCE PARTICIPATION BY RACE/ETHNICITY Prepared by the Community Service Council, with support from the Metropolitan Human Services Commission (5/20/2013).
Civilian Labor Force Participation for Persons 16 & Older by Race/Ethnicity 102,371,000 30,493,000 19,676,000 9,430,000 4,738,000 Source: Toossi, Mitra. “Employment Outlook: 2010-2020: Labor Force Projections to 2020: A More Slowly Growing Workforce,” Monthly Labor Review, January 2012. Prepared by the Community Service Council, with support from the Metropolitan Human Services Commission (5/20/2013).
Civilian Labor Force Participation Rates for Persons 16 & Older by Race/Ethnicity 66.2% 63.1% 62.0% 61.4% 60.3% Source: Toossi, Mitra. “Employment Outlook: 2010-2020: Labor Force Projections to 2020: A More Slowly Growing Workforce,” Monthly Labor Review, January 2012. Prepared by the Community Service Council, with support from the Metropolitan Human Services Commission (5/20/2013).
Civilian Labor Force Participation Rates for Persons 16 & Older by Race/Ethnicity and by Sex 75.9% 71.0% 67.2% 63.4% 63.1% 59.5% 57.9% 57.2% 56.1% 56.1% Source: Toossi, Mitra. “Employment Outlook: 2010-2020: Labor Force Projections to 2020: A More Slowly Growing Workforce,” Monthly Labor Review, January 2012. Prepared by the Community Service Council, with support from the Metropolitan Human Services Commission (5/20/2013).
Percent Distribution of Civilian Labor Force for Persons 16 & Older by Race/Ethnicity 62.3% 18.6% 12.0% 5.7% 2.9% Source: Toossi, Mitra. “Employment Outlook: 2010-2020: Labor Force Projections to 2020: A More Slowly Growing Workforce,” Monthly Labor Review, January 2012. Prepared by the Community Service Council, with support from the Metropolitan Human Services Commission (5/20/2013).
LABOR FORCE PARTICIPATION BY SEX Prepared by the Community Service Council, with support from the Metropolitan Human Services Commission (5/20/2013).
Civilian Labor Force Participation Rates for Persons 16 & Older by Sex 68.2% 62.5% 57.1% Source: Toossi, Mitra. “Employment Outlook: 2010-2020: Labor Force Projections to 2020: A More Slowly Growing Workforce,” Monthly Labor Review, January 2012. Prepared by the Community Service Council, with support from the Metropolitan Human Services Commission (5/20/2013).
Labor force participation among the older population Prepared by the Community Service Council, with support from the Metropolitan Human Services Commission (5/20/2013).
CIVILIAN LABOR FORCE PARTICIPATION AMONG THE OLDER POPULATION Prepared by the Community Service Council, with support from the Metropolitan Human Services Commission (5/20/2013).
Civilian Labor Force Participation for Persons 55 & Older by Age Group 29,298,000 9,945,000 2,168,000 Source: Toossi, Mitra. “Employment Outlook: 2010-2020: Labor Force Projections to 2020: A More Slowly Growing Workforce,” Monthly Labor Review, January 2012. Prepared by the Community Service Council, with support from the Metropolitan Human Services Commission (5/20/2013).
Civilian Labor Force Participation for Persons 55 & Older by Sex 41,411,000 21,052,000 20,358,000 Source: Toossi, Mitra. “Employment Outlook: 2010-2020: Labor Force Projections to 2020: A More Slowly Growing Workforce,” Monthly Labor Review, January 2012. Prepared by the Community Service Council, with support from the Metropolitan Human Services Commission (5/20/2013).
Civilian Labor Force Participation for Persons 55 to 64 by Sex 29,298,000 14,662,000 14,637,000 Source: Toossi, Mitra. “Employment Outlook: 2010-2020: Labor Force Projections to 2020: A More Slowly Growing Workforce,” Monthly Labor Review, January 2012. Prepared by the Community Service Council, with support from the Metropolitan Human Services Commission (5/20/2013).
Civilian Labor Force Participation for Persons 65 to 74 by Sex 9,945,000 5,236,000 4,709,000 Source: Toossi, Mitra. “Employment Outlook: 2010-2020: Labor Force Projections to 2020: A More Slowly Growing Workforce,” Monthly Labor Review, January 2012. Prepared by the Community Service Council, with support from the Metropolitan Human Services Commission (5/20/2013).
Civilian Labor Force Participation for Persons 75 & Older by Sex 2,168,000 1,155,000 1,012,000 Source: Toossi, Mitra. “Employment Outlook: 2010-2020: Labor Force Projections to 2020: A More Slowly Growing Workforce,” Monthly Labor Review, January 2012. Prepared by the Community Service Council, with support from the Metropolitan Human Services Commission (5/20/2013).
CIVILIAN LABOR FORCE PARTICIPATION RATES AMONG THE OLDER POPULATION Prepared by the Community Service Council, with support from the Metropolitan Human Services Commission (5/20/2013).
Civilian Labor Force Participation Rates among Persons 55 & Older by Age Group 76.3% 60.9% 37.8% 22.8% 15.2% Source: Toossi, Mitra. “Employment Outlook: 2010-2020: Labor Force Projections to 2020: A More Slowly Growing Workforce,” Monthly Labor Review, January 2012. Prepared by the Community Service Council, with support from the Metropolitan Human Services Commission (5/20/2013).
Civilian Labor Force Participation Rates among Persons 55 & Older by Sex 47.3% 43.0% 39.3% Source: Toossi, Mitra. “Employment Outlook: 2010-2020: Labor Force Projections to 2020: A More Slowly Growing Workforce,” Monthly Labor Review, January 2012. Prepared by the Community Service Council, with support from the Metropolitan Human Services Commission (5/20/2013).
Civilian Labor Force Participation Rates among Persons 55 to 59 by Sex 78.6% 76.3% 74.1% Source: Toossi, Mitra. “Employment Outlook: 2010-2020: Labor Force Projections to 2020: A More Slowly Growing Workforce,” Monthly Labor Review, January 2012. Prepared by the Community Service Council, with support from the Metropolitan Human Services Commission (5/20/2013).
Civilian Labor Force Participation Rates among Persons 60 to 64 by Sex 63.2% 60.9% 58.8% Source: Toossi, Mitra. “Employment Outlook: 2010-2020: Labor Force Projections to 2020: A More Slowly Growing Workforce,” Monthly Labor Review, January 2012. Prepared by the Community Service Council, with support from the Metropolitan Human Services Commission (5/20/2013).
Civilian Labor Force Participation Rates among Persons 65 to 69 by Sex 41.4% 37.8% 34.5% Source: Toossi, Mitra. “Employment Outlook: 2010-2020: Labor Force Projections to 2020: A More Slowly Growing Workforce,” Monthly Labor Review, January 2012. Prepared by the Community Service Council, with support from the Metropolitan Human Services Commission (5/20/2013).
Civilian Labor Force Participation Rates among Persons 70 to 74 by Sex 27.0% 22.8% 19.2% Source: Toossi, Mitra. “Employment Outlook: 2010-2020: Labor Force Projections to 2020: A More Slowly Growing Workforce,” Monthly Labor Review, January 2012. Prepared by the Community Service Council, with support from the Metropolitan Human Services Commission (5/20/2013).
Civilian Labor Force Participation Rates among Persons 75 to 79 by Sex 18.2% 15.2% 13.0% Source: Toossi, Mitra. “Employment Outlook: 2010-2020: Labor Force Projections to 2020: A More Slowly Growing Workforce,” Monthly Labor Review, January 2012. Prepared by the Community Service Council, with support from the Metropolitan Human Services Commission (5/20/2013).
Civilian Labor Force Participation Rates among Persons 75 & Older by Sex 12.8% 10.0% 8.0% Source: Toossi, Mitra. “Employment Outlook: 2010-2020: Labor Force Projections to 2020: A More Slowly Growing Workforce,” Monthly Labor Review, January 2012. Prepared by the Community Service Council, with support from the Metropolitan Human Services Commission (5/20/2013).
Labor force participation among the younger population Prepared by the Community Service Council, with support from the Metropolitan Human Services Commission (5/20/2013).
CIVILIAN LABOR FORCE PARTICIPATION AMONG THE YOUNGER POPULATION Prepared by the Community Service Council, with support from the Metropolitan Human Services Commission (5/20/2013).
Civilian Labor Force Participation for Persons 16 to 24 by Age Group 13,783,000 4,548,000 Source: Toossi, Mitra. “Employment Outlook: 2010-2020: Labor Force Projections to 2020: A More Slowly Growing Workforce,” Monthly Labor Review, January 2012. Prepared by the Community Service Council, with support from the Metropolitan Human Services Commission (5/20/2013).
Civilian Labor Force Participation for Persons 16 to 24 by Sex 18,330,000 9,690,000 8,641,000 Source: Toossi, Mitra. “Employment Outlook: 2010-2020: Labor Force Projections to 2020: A More Slowly Growing Workforce,” Monthly Labor Review, January 2012. Prepared by the Community Service Council, with support from the Metropolitan Human Services Commission (5/20/2013).
Civilian Labor Force Participation for Persons 16 to 19 by Sex 4,548,000 2,413,000 2,134,000 Source: Toossi, Mitra. “Employment Outlook: 2010-2020: Labor Force Projections to 2020: A More Slowly Growing Workforce,” Monthly Labor Review, January 2012. Prepared by the Community Service Council, with support from the Metropolitan Human Services Commission (5/20/2013).
Civilian Labor Force Participation for Persons 20 to 24 by Sex 13,783,000 7,276,000 6,506,000 Source: Toossi, Mitra. “Employment Outlook: 2010-2020: Labor Force Projections to 2020: A More Slowly Growing Workforce,” Monthly Labor Review, January 2012. Prepared by the Community Service Council, with support from the Metropolitan Human Services Commission (5/20/2013).
CIVILIAN LABOR FORCE PARTICIPATION RATES AMONG THE YOUNGER POPULATION Prepared by the Community Service Council, with support from the Metropolitan Human Services Commission (5/20/2013).
Civilian Labor Force Participation Rates among Persons 16 to 24 by Age Group 65.9% 26.5% Source: Toossi, Mitra. “Employment Outlook: 2010-2020: Labor Force Projections to 2020: A More Slowly Growing Workforce,” Monthly Labor Review, January 2012. Prepared by the Community Service Council, with support from the Metropolitan Human Services Commission (5/20/2013).
Civilian Labor Force Participation Rates among Persons 16 to 24 by Sex 50.6% 48.2% 45.7% Source: Toossi, Mitra. “Employment Outlook: 2010-2020: Labor Force Projections to 2020: A More Slowly Growing Workforce,” Monthly Labor Review, January 2012. Prepared by the Community Service Council, with support from the Metropolitan Human Services Commission (5/20/2013).
Civilian Labor Force Participation Rates among Persons 16 to 19 by Sex 27.9% 26.5% 25.2% Source: Toossi, Mitra. “Employment Outlook: 2010-2020: Labor Force Projections to 2020: A More Slowly Growing Workforce,” Monthly Labor Review, January 2012. Prepared by the Community Service Council, with support from the Metropolitan Human Services Commission (5/20/2013).
Civilian Labor Force Participation Rates among Persons 20 to 24 by Sex 69.4% 65.9% 62.3% Source: Toossi, Mitra. “Employment Outlook: 2010-2020: Labor Force Projections to 2020: A More Slowly Growing Workforce,” Monthly Labor Review, January 2012. Prepared by the Community Service Council, with support from the Metropolitan Human Services Commission (5/20/2013).