Download
1 / 18
180 likes | 253 Views
This study presents long-term simulations of NO2, O3, and NO3- in East Asia using the updated RAQM model. Advection and dry deposition schemes were modified for improved accuracy. The model successfully captures NO2 and O3 levels monthly and daily. Natural emissions play a significant role in regions with more forests. The study also evaluates the impact of land use and topography on air quality across the region.

E N D
Long-term simulations of NO2, O3, and NO3- in East Asia Junling An ADORC, Japan
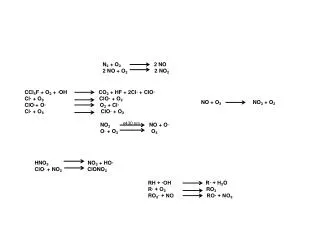
RAQM model • Updated /modified • Advection scheme: modif. & simplif. to the Bott (1992) approach • Dry dep.: modified Wesely’s scheme (Walmsley & Wesely, 1996) • Gas Chemistry: condensed CBIV (He & Huang, 1992; An et al., 1999ab)
Application of the RAQM model • Sulfur transport in East Asia (Huang et al., 1995) • Strong Kosa events during springs (Huang et al.,1998; Wang et al.,2000a) • Neutralization of acid rain by Kosa (Ueda et al.,2000) • High-ozone events occurred in northern Taiwan (Wang et al.,2000b) • Regional air quality over the Mainland of China (An et al.,2001)
Model domain & monitor. sites 5 -- China 10 -- Japan 2 -- South Korea 2 -- Malasia 2 -- Mongolia 1 -- Philippines 1 -- Russia 3 -- Thailand 2 -- Vietnam
Input data • Meteor. Fields: 4 times per day from NCEP • Precipitation: GPCC (Global Precipitation Climatology Center) • Emissions: SO2, NOx, NH3, & VOC (Klimont et al., 2001) • Land use: DeFries & Townshend (1994) • Topography: Data Center of IAP
Conclusions • Well simulated in July & December: NO2 & O3 (daily); NO3- (monthly) • Liquid chemistry: may not substantially influence NO3- conc. on a regional scale and long-term simulations • Natural emissions: significant for some sites with more forests