Download
1 / 28
280 likes | 365 Views
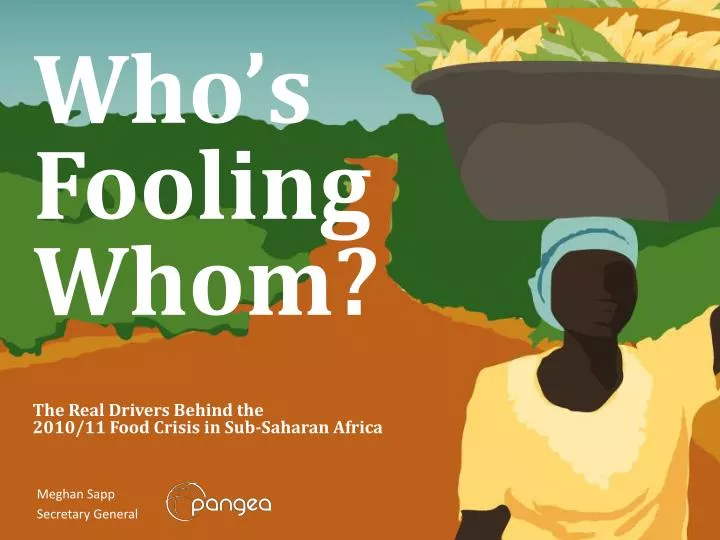
Who ’ s Fooling Whom? The Real Drivers Behind the 2010/11 Food Crisis in Sub-Saharan Africa. Meghan Sapp Secretary General. Food vs. Fuel?. Food price spikes—2008/09, 2009/10, 2010/11 Crop failures, low global cereals stocks, increased demand for feed, increased demand for meat

E N D
Who’s Fooling Whom? The Real Drivers Behind the 2010/11 Food Crisis in Sub-Saharan Africa Meghan Sapp Secretary General
Food vs. Fuel? • Food price spikes—2008/09, 2009/10, 2010/11 • Crop failures, low global cereals stocks, increased demand for feed, increased demand for meat • Maize riots • EU RED • US RFS • Biofuels to blame? • 75%?!
Lots of questions, even more assumptions, but few answers.
The study • 269 price series of six staple crops • cassava • maize • millet • rice • sorghum • and wheat • 20 African food markets • What’s the impact on African food prices during the spikes?
Where’s the price transmission? • Consumed locally: • Sorghum • Maize • Cassava • Millet • Imports: • Wheat—EU, Australia, US, Canada, Argentina • Rice—Thailand
Causes of food insecurity • Underinvestment in agriculture • Lack of market access • Lack of storage • Postharvest losses • EU/US agricultural subsidies • Rising oil prices • Lack of energy access
Under-investment in agriculture “A 1% gain in GDP originating from agriculture will generate a 6% increase in overall expenditure of the poorest 10% of the population; in contrast a 1% gain in GDP originating from non-agricultural sectors creates zero growth” (Conway and Wilson. 2013).
Lack of storage • Without storage: • Surpluses spoil and go to waste • Inability to hold supplies back from market until prices are higher • Markets flood in times of surplus, no ability to store stock during times of poor crops • With storage: • Communities better able to manage stocks • Farmers get better prices • Crops retain nutrition levels
Postharvest losses • FAO defines “postharvest losses” as a measurable quantitative and qualitative loss in a given product. These losses can happen in any of the post-harvest phases, which are identified as harvest, handling, threshing, drying, storage, packaging and transport. • OECD countries: losses occur largely at the consumption stage • Africa: most losses are due to poor processing, handling and storage. FAO estimates postharvest grain losses in SSA reach about US$4 billion a year.
Postharvest losses FAO study: Global food losses and waste • for cereals: roughly 25% • for root crops and fruits and vegetables: roughly 30% • for oilseeds: 40-50% • for meat and dairy: 20% • fish losses: 30% Leads to: • Low farmer income • Higher food prices by removing food from supply
EU and US agricultural subsidies • Direct farmer subsidies and crop supports • Subsidised insurance • Dumping • Non-tariff trade barriers Leads to: • Between US$50 billion and US$64 billion in lost agricultural earnings per year • Lower small farmer income by 10%-15% • Decline in sugar exports to 54% from 71% during 1980-2000
Lack of energy access Source: FAO
Finding solutions • Education • Ownership and finance • Agro-Ecological Zoning • Reducing postharvest losses • Integrated food and energy systems
Education • Knowledge feedback loop • Agriculture • Increased yields • Higher returns • More income to spend on education and health • Health and sanitation • Healthy people make better farmers • Knowledge reduces disease transmission • Health directly impacts agricultural yields • Educated women have better access to financial decision making • Women typically responsible for food; men typically responsible for cash crops
Ownership and finance • Linked to education • Micro-finance • Micro-insurance • Land tenure • Improved roles for women
Agro-Ecological Zoning • Brazil • Sugarcane and oil palm • Mozambique • 1:1.000.000 • 1:250.000 • Senegal • FGV • Not yet implemented • Opportunities to improve land tenure, increase investor confidence, reduce food insecurity risks
Reducing postharvest losses World Bank: • Better management along the PH chain • Pest and storage management • Institutional arrangement for better marketing • Support for technological improvements and adoption of better practices Introduction of technologies to reduce PHL • Storage • Processing • Powered by bioenergy from crop waste
Thank you for your attention. /PANGEA_LINK www.pangealink.org