Download
1 / 4
40 likes | 188 Views
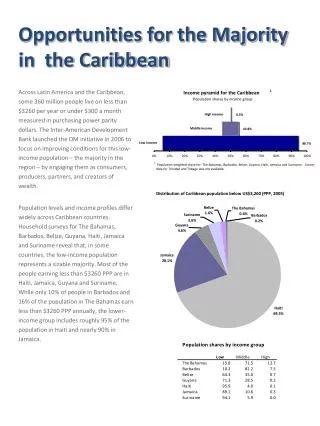
High income. Middle income. Low income. Opportunities for the Majority in the Caribbean. 1. Income pyramid for the Caribbean. Population shares by income group. 0.5%. 10.8%. 88.7%. 0%. 10%. 20%. 30%. 40%. 50%. 60%. 70%. 80%. 90%. 100%. 1.

E N D
High income Middle income Low income Opportunities for the Majority in the Caribbean 1 Income pyramid for the Caribbean Population shares by income group 0.5% 10.8% 88.7% 0% 10% 20% 30% 40% 50% 60% 70% 80% 90% 100% 1. Population weighted share for: The Bahamas, Barbados, Belize, Guyana, Haiti, Jamaica and Suriname. Survey data for Trinidad and Tobago was not available. Distribution of Caribbean population below US$3,260 (PPP, 2005) Belize The Bahamas 1.6% 0.4% Suriname Barbados 3.6% 0.2% Guyana 4.6% Across Latin America and the Caribbean, some 360 million people live on less than $3260 per year or under $300 a month measured in purchasing power parity dollars. The Inter-American Development Bank launched the OM initiative in 2006 to focus on improving conditions for this low-income population – the majority in the region – by engaging them as consumers, producers, partners, and creators of wealth. Population levels and income profiles differ widely across Caribbean countries. Household surveys for The Bahamas, Barbados, Belize, Guyana, Haiti, Jamaica and Suriname reveal that, in some countries, the low-income population represents a sizable majority. Most of the people earning less than $3260 PPP are in Haiti, Jamaica, Guyana and Suriname. While only 10% of people in Barbados and 16% of the population in The Bahamas earn less than $3260 PPP annually, the lower-income group includes roughly 95% of the population in Haiti and nearly 90% in Jamaica. Jamaica 20.1% Haiti 69.5%
The Bahamas $90 million Belize $ 288 million Jamaica Haiti Barbados $ 2,786 million $4,182 million $56 million Guyana $892 million Suriname $ 385 million The Market of the Majority Total income of the population earning below $3,260 (PPP) per capita (millions of PPP dollars, 2005) The Bahamas Pop. 51 thousands Inc. 90 millions Belize Inc. 288 millions Jamaica Haiti Pop. 2,368 thousands Pop. 8,175 thousands Barbados Inc. 2,786 millions Inc. 4,182 millions Pop. 28 thousands Inc. 56 millions Guyana Pop. 536 thousands Inc. 892 millions Suriname Pop. 423 thousands Inc. 385 millions Over 11 million people across the Caribbean have incomes below $3260 PPP annually according to available household surveys. This important and underserved market amounts to nearly $8.7 billion in total annual income measured in purchasing power parity dollars. New business models and partnerships are needed to serve this vast market and to engage a largely untapped constituency of potential producers and creators of goods and services. Majority Market by Country Total Income in Millions of PPP dollars (2005) Haiti Suriname $4,182 Jamaica $385 100 $2,786 Guyana 80 $892 Belize $288 60 Low income share of total population (%) 40 The Bahamas $90 20 Barbados $56 0
The Poverty Penalty The low-income population is subject to a poverty penalty in the form of reduced access to goods and services as well as higher prices. Reducing the poverty penalty calls for action and innovation from the public, private and non-profit sectors. Several Caribbean governments, unlike many in other regions, have secured virtually equal access to education at the primary level across income groups. However, access to other goods and services is less equal. Despite comparatively advanced social indicators in most Caribbean countries, a sizable proportion of the population in several countries still lacks access to piped water. Similarly, the low-income group is more likely than higher income groups to lack adequate access to sanitation. At the time of the latest household surveys in the Caribbean, the Majority also had strikingly less access to fixed telephone lines. Importantly, the impact of this disparity has been significantly reduced in some countries in only a few years by the entrepreneurial application of new technology and business models that brought cellular phones within the reach of the low-income majority. Average income per year by income group per capita PPP (in US$, 2005) $16,000 Middle and High income $14,000 National Average $12,000 $10,000 $8,000 $6,000 $4,000 $2,000 Low income $0 The Barbados Belize Guyana Haiti Jamaica Suriname Bahamas
About the data The indicators presented in this report were calculated from national income and consumption surveys. No survey was available for Trinidad and Tobago and hence it has been excluded from this analysis. The data for Suriname was obtained from a survey that only covered the district of Paramaribo; hence, the results are representative at that level. For comparability purposes, similar income or consumption definitions have been used for all the countries, and local currency has been adjusted using international dollars (purchasing power parity exchange rates) and set to a common year (2005) using the United States’ Consumer Price Index. The methodology used is the same as that applied in the report “THE MARKET OF THE MAJORITY: The BOP Opportunity Map of Latin America and the Caribbean” prepared by the World Resource Institute for the Inter-American Development Bank (June 2006). As it is defined in that document, the population with annual incomes less than US$3,260 (purchasing power parity – PPP in 2005 US) are considered “the Majority”, those above this line but less than US $21,731 PPP (2005 dollars) are the middle. The remainder—those reporting incomes greater than US $21,731 PPP (2005 dollars)—is the high income group. PPP Conversion factors The PPP conversion factors for all countries except Guyana and Suriname were obtained from the World Development Indicators (consulted in January, 2007). For the Guyana and Suriname the source is: Alan Heston, Robert Summers and Bettina Aten, Penn World Table Version 6.2, Center for International Comparisons of Production, Income and Prices at the University of Pennsylvania, September 2006. Although the conversion factors allow comparability, the results are sensitive to them. Surveys used May2007