Download
1 / 42
440 likes | 604 Views
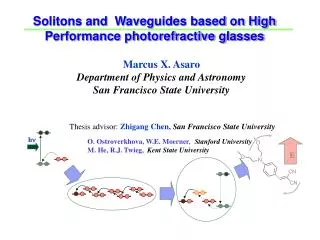
Solitons and Waveguides based on High Performance photorefractive glasses. Marcus X. Asaro Department of Physics and Astronomy San Francisco State University Thesis advisor: Zhigang Chen, San Francisco State University. O. Ostroverkhova, W.E. Moerner , Stanford University

E N D
Solitons and Waveguides based on High Performance photorefractive glasses Marcus X. Asaro Department of Physics and Astronomy San Francisco State University Thesis advisor:Zhigang Chen, San Francisco State University O. Ostroverkhova, W.E. Moerner, Stanford University M. He, R.J. Twieg, Kent State University hn E
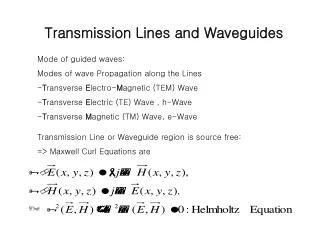
Outline • Select review of linear optics • Linear polarization • Birefringence • Nonlinear optics • Linear electro-optic effect • Band transport model • Index change • Soliton formation in Photorefractive (PR) crystals
Outline • New PR material • DCDHF-based organic glass • Orientational PR nonlinearity • Experimental observations • Focusing and defocusing cases • Optically induced waveguides • Disussion of other effects • Conclusion
Linear optics • Optical phenomena commonly observed in nature such as reflection, refraction, and birefringence result from linear interactions with matter. • In this conventional (linear) regime, the polarization induced in the medium is linearly proportional to the electric field E of an applied optical wave: P = εoc(1)E .
Linear optics • In a linear medium the refractive index n0 is a constant, independent of beam intensity for a given l. • Also, different f of light encounter slightly different indices of refraction • Given c, a description of the refractive index follows: D = εoE + P = εo(1+c)E = εoE ε = εo(1+c) n2 = (1+c)
Linear optics • Some materials have two values of n depending on the polarization of the light. These are called no and ne • This property is called birefringence • Birefringence (BR) occurs in anisotropic materials → c-axis • If an unpolarized beam propagates along c-axis−light does not split Optic (c-) axis e-ray E o-ray Extraordinary ray Ordinary ray k is ( to phase front) now to D, notE. k is to both D and E (D || E) S is not || to k S is || to k o-wave “feels” isotropic medium
Nonlinear optics • Certain materials change their optical properties (such as n) when subjected to an intense applied electric field. This can be either an optical field (optical Kerr effect) or a DC field (electro-optic effect). We will focus on the second effect for this talk. • The large applied field distorts the positions, orientations, • or shapes of the molecules giving rise to polarizations that • exhibit nonlinear behavior. • P = εo(c(1)E + c(2)E2 +c(3)E3 +… ) • = PLinear+ Pnon-linear
Nonlinear optics • Electro-optic (EO) effect: apply an electric field => Result: refractive index change−two forms (a) c(2)→n E: linear electro-optic or Pockels effect (b) c(3) →n E2: quadratic electro-optic or DC Kerr effect • c(2) process→
EO dielectrics→ Photorefractive crystals • Typical values are: beam at mW/cm2, E=10 V/m • n = 10−4− 10−6 • Noncentrosymmetric (lacking inversion symmetry) • crystals are used. c-axis Input beam
Photorefractive effect: ? • The photorefractive (PR) effect refers to spatial modulation of the index of refraction generated by a specific mechanism: • Light-induced charge redistribution in a material in which the index depends upon the electric field Pockels effect • To understand PR effect, its physical process must be understood
Smaller Larger density density Applied electric field E0 Esc PR band transport model for inorganics Diffusion • Nonuniform illumination 1. Charge photo- generation e− Con duction band 2. Diffusion and drift=migration u h Donor impurities N N 3. Trapping of the charges D D+ Acceptor impurities N A 4. Space-charge field arises Valence band The Band transport model for organic PR materials differs somewhat
I(x) • E(x) • n > 0 • n=n3reffE/2 < 0 (a) (b) (c) x x x n=0 Photorefractive effect: Index change • We have seen physically how a net electric field is formed. • How does this affect the index of refraction?
Diffraction The photorefractive effect: solitons Self-focusing is a result of the photorefractive effect in a nonlinear optical material... Linear medium(no photorefractive effect): Narrow optical beams propagate w/o affecting the properties of the medium. Optical waves tend to broaden with distance and naturally diffract. Broadening due to diffraction.
Spatial Soliton The photorefractive effect: solitons Nonlinear medium: Photorefractive (PR) EffectThe presence of light modifies the refractive index such that a non-uniform refractive index change, Dn, results. Self-focusingThis index change acts like a lens to the light and so the beam focuses. When the self-focusing exactly compensates for the diffraction of the beam we get a soliton. Narrowing of a light beam through a nonlinear effect.
Optical spatial solitons • Soliton geometries and resulting beam profiles
Optical spatial solitons • In optics, spatial solitons represent a balance between self-focusing and diffraction effects. • Observed in a variety of nonlinear materials Inorganic PR crystal Optical Kerr media Liquid crystals …... Can optical solitons be created in organic polymers/glasses?
Compounds under study* 676 nm 676 nm C60 (0.5 wt%) • DCDHF-6-C7M chromophore • Tg=33° C, unstable DCDHF-6 chromophore Tg=19° C, unstable PR gain: G~220 cm-1 at 30 V/mm Low absorption a~12 cm-1 at 676 nm DCDHF-6 + DCDHF-6-C7M (1:1 wt mixture) Tg=23° C, stable *From O. Ostroverkhova
Sample construction Spacer
2.00kV o.ookV y I(x) Polarization of Laser x x M. Shih et al., Opt. Lett. (1999). E(x) Side View In out x Dn(x) > 0 - x x < 0
Mechanism: Orientational photorefractive effect • PR organic polymers/glasses exhibit an orientationally enhanced PR effect To analyze, note: • NLO chromophores contribute individual PR effects → calculations at the molecular level → start with p not P • Each rod-like chromophore will exhibit a dipole moment • Due to the rod shape we have and
Mechanism: Orientational photorefractive effect • Macroscopic model needs to account for all orientations in the sample → take the orientational average of all the dipole moments per unit vol. • Find the change in macroscopic polarization for E=0 and E=E0 • < > can be calculated using dist. function. Finally, from n2 = 1+
Mechanism: Orientational photorefractive effect > 0 < 0 D n(x) > 0 W. E. Moerner et al., J. Opt. Soc. Am. B (1994). D n(x) < 0 x M. Shih et al., Opt. Lett. (1999).
Experimental setup: 1-D solitons Sample x-polarization CCD Cylindrical lens Imaging lens Collimation lenses x z y Typical image of diffraction at the output face /2 wave- plate Diode laser Samples with different thickness and different Wt% of C60 were tested.
Can PR glasses support solitons? Diffracting 55 mm Conducting polymer No voltage applied l=780nm at 24mW 2.5mm Self-focusing 120 m m ITO-coated glass 12 mm 2.0 kV applied across sample x x z y y M. Shih, F. Sheu, Opt. Lett., 24 1853 (1999)
Experimental results: 1D soliton formation Input to sample Output from sample x Y-polarized (Self -focusing) 12 mm X-polarized (Self-defocusing) y V=0 V=2 kV Poling field along x-direction Insensitive to polarity of field
Experimental results: Soliton data Time lapse ~160 s Click to play Self-defocusing 55 mm Conducting polymer 80 mm Vertical polarization Click to play Self-focusing Conducting polymer 12 mm x Horizontal polarization z x y www.physics.sfsu.edu/~laser/movies.html y
From left to right, the voltage was increased independently. It appears that there is a critical value of applied field that favors soliton formation for a given laser power. Experimental results: Variable bias field Nonlinearity increases as voltage increaese 0.0 kV 1.0 kV 2.0 kV 3.0 kV • If the field is too low only partial focusing occurs. • If the field is too strong, the nonlinearity is too high so the beam breaks up. Y. S. Kivshar and D. E. Pelinovsky, Phys Report 331, 117 (2000).
Experimental results: Soliton stability At 0 seconds voltage was applied 150 seconds 500 seconds (decay) • Soliton formation from self-trapping occurred 160 sec after a 2.0 kV field was applied. • The soliton was stable for more than 100 seconds and then decayed. • Self-defocusing exhibited similar behavior.
Experimental setup: waveguide Sample /2 wave- plate y-polarization To CCD Soliton beam Cylindrical lens Collimation lenses Moveable mirror Probe beam x z y
Experimentalresults: planar waveguide Input output (0V) output (2.7kV) output (V off) y 1. Stripe soliton created first Soliton (780nm) Probe (980nm) x 2. Probe beam switched on 3. Guidance observed 4. Branching observed when turning off V
Experimentalresults: planar waveguide Click to play Soliton beam on first Probe beam on later Probe beam does not form soliton itself ! y x
Experimental results: circular waveguide Input output (v=0) output (v=2 kV) y Soliton (780nm) Probe (980nm) 19 mm x ~65 s
2D soliton formation • The applied field is 16 V/m • Beam power at 36 mW • Self-trapping of the circular beam occurred in ~65 s • ~19 m beam diameter Click to play
Soliton formation time The response time depends on poling field and the beam power. Soliton forms faster in a “pre-poled” sample. 780 nm
Soliton/Waveguide formation speed • Goal: Fast material response for applications • Preliminary findings : faster at 1% dopant concentrations • Future investigation: synthetic modifications of the DCDHF chromophores mixing DCDHF derivatives in various concentrations
Stability issues • crystallization of chromophores scattering, opaque re-heating sample at ~130 C and cool down very fast optimize sample fabrication • photostability slow degradation of performance move to new spot on the sample novel organic compounds • electrical breakdowns no HV possible anymore purified materials, cleaner sample preparation operation only in safe region: E = 0-60 V/mm
a b ITO Glass ITO Glass No transmission Thin film y x ITO Glass ITO Glass Stability issues
Conclusions • A brief discussion of birefringence illustrated behavior important to orientationally enhanced birefringence. • The band transport model showed the process of photo-charge generation migration, and trapping as part of the PR effect. • An intuitive explanation for soliton formation was given • Index change equations were presented that govern the NL response. • Cont…
Conclusions • The DCDHF glasses are high performance PR organic materials • Solitons/waveguides were realized in such glasses for the first time. • Optically-induced self-focusing-to-defocusing switching • Both 1D and 2D solitons have been verified. • Planar and circular soliton waveguides have been demonstrated. • The speed for soliton/waveguide formation can be greatly improved.
APPENDIX 2: Applications • PASSIVE APPS • Polarization induced switching • Coupling with fiber and reconfigurable directional couplers • based on two bright solitons formed in close proximity • ACTIVE DEVICES • Logic operations might be carried out by having two solitons • interact • Using an asymmetric transverse intensity profile, direction of • propagation can be changed by changing the bias voltage, as a • consequence of self-bending
100oC APPENDIX 3: Sample preparation all “ingredients” are dissolved and mixed together freeze-dried and solvent removed with vacuum pump remaining solvent removed in oven spacer dripped onto ITO coated glass slides melted on substrates sandwiched at 120oC