Download
1 / 16
160 likes | 366 Views
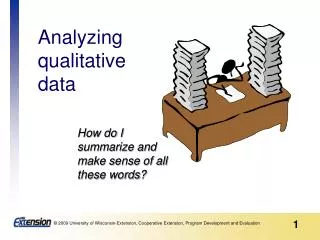
Analyzing qualitative data . How do I summarize and make sense of all these words? . Qualitative or narrative data may come from…. Open-ended questions and written comments on questionnaires Testimonials Interviews Focus groups Logs, journals, diaries Observations,

E N D
Analyzing qualitative data How do I summarize and make sense of all these words?
Qualitative or narrative data may come from… • Open-ended questions and written comments on questionnaires • Testimonials • Interviews • Focus groups • Logs, journals, diaries • Observations, • Documents, reports, news articles • Stories • Case studies
The narrative responses may be brief or very long and detailed. Your job is to make sense of these data and to make them understandable for others.
See the booklet Analyzing Qualitative Data to supplement the information on these slides. http://learningstore.uwex.edu/pdf/G3658-12.PDF
Typical errors in qualitative data analysis • Listing all narrative comments without doing any analysis • Including information that makes it possible to identify the respondent. • Generalizing from comments to the whole group. Qualitative information seeks to provide unique insights, understanding and explanation – it is not to be generalized. • Using quotes to provide a positive spin. Consider your purpose for including quotes.
A common approach for analyzing qualitative data is called content analysis. It involves 5 steps: • Get to know your data • Focus the analysis • Categorize the information • Identify themes or pattern • Organize them into coherent categories • Identify patterns and connections within and between categories • Interpretation – bring it all together
Step 1. Get to know your data Good qualitative data analysis depends upon understanding your data. Spend time getting to “know” your data. • Read and re-read the text • Listen to tape recordings if you have them; transcribe data • Check the quality of the data. Is it complete and understandable. It it likely to add meaning and value? Was it collected in an unbiased way?
Step 2. Focus the analysis • Review the purpose of the evaluation and what you wanted to find out. • Based on your ‘getting to know your data’, think about a few questions that you want your analysis to answer and write them down. • You might focus your analysis by question, topic, time period, event, individual or group.
Step 3. Categorize information Some people call this process ‘coding’ the data. It involves reading the data and giving labels or codes to the themes and ideas that you find. You may have themes or ideas you search for (pre-set categories) and/or create categories (emergent categories) as you work with the data.
Example of categorizing information using hand coding Each response is read and given a code to represent a different concept (category): Trg = training T = time R = resources P = program Fdbk = feedback M= mentor U = uncertain Then, the data can be sorted and organized by category to identify patterns and bring meaning to the responses.
If you’ve entered your data into a word processing file, you might highlight quotes and type category labels in the margins. It is a good idea to leave a wide margin when you create the file so you have space to type in the margins.
Or, you might use Excel to organize and categorize your data Example data set
Step 4. Identify patterns within and between categories • Once you have identified the categories, you might: • Sort and assemble all data by theme • Sort and assemble data into larger categories • Count the number of times certain themes arise to show relative importance (not suitable for statistical analysis) • Show relationships among categories
Working with others (key stakeholders, other program staff, participants) in the coding and interpretation process is helpful. For example, several people might review the data independently to identify categories. Then, you can compare categories and resolve any discrepancies. How else might you involve others in your qualitative data analysis?
Step 5. Interpretation • Now, stand back and think about what you’ve learned. What do these categories and patterns mean? What is really important? • What did you learn?
Congratulations! Learning how to analyze qualitative data is a rich and rewarding experience. The more you practice, the easier it will become. Have fun!!