Download

1 / 28
290 likes | 366 Views
Measures of Variation. Range Standard Deviation Variance. The Range. the difference between the largest and smallest values of a distribution. Find the range:. 10, 13, 17, 17, 18 The range = largest minus smallest = 18 minus 10 = 8. The standard deviation.

E N D
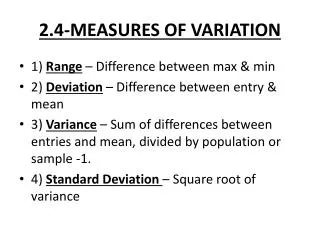
Measures of Variation • Range • Standard Deviation • Variance
The Range the difference between the largest and smallest values of a distribution
Find the range: 10, 13, 17, 17, 18 The range = largest minus smallest = 18 minus 10 = 8
The standard deviation a measure of the average variation of the data entries from the mean
Standard deviation of a sample mean of the sample n = sample size
To calculate standard deviation of a sample • Calculate the mean of the sample. • Find the difference between each entry (x) and the mean. These differences will add up to zero. • Square the deviations from the mean. • Sum the squares of the deviations from the mean. • Divide the sum by (n 1) to get the variance. • Take the square root of the variance to get the standard deviation.
The Variance the square of the standard deviation
Find the standard deviation and variance x 30 26 22 4 0 4 16 0 16 ___ Sum = 0 78 32 mean= 26
The variance = 32 2 =16
Find the mean, the standard deviation and variance Find the mean, the standard deviation and variance x 4 5 5 7 4 1 0 0 2 1 1 0 0 4 1 mean = 5 25 6
To find Square the x values, then add.
To find Sum the x values, then square.
Use the computing formulas to find s and s2 x 4 5 5 7 4 x2 16 25 25 49 16 n = 5 (Sx) 2 = 25 2 =625 Sx2 = 131 SSx = 131 – 625/5 = 6 s2 = 6/(5 –1) = 1.5 s = 1.22 131 25
COEFFICIENT OF VARIATION: a measurement of the relative variability (or consistency) of data
CV is used to compare variability or consistency • A sample of newborn infants had a mean weight of 6.2 pounds with a standard deviation of 1 pound. • A sample of three-month-old children had a mean weight of 10.5 pounds with a standard deviation of 1.5 pounds. • Which (newborns or 3-month-olds) are more variable in weight?
To compare variability, compare Coefficient of Variation For newborns: For 3-month-olds: • Higher CV: more variable CV = 16% CV = 14% Lower CV: more consistent
Use Coefficient of Variation To compare two groups of data, to answer: Which is more consistent? Which is more variable?
CHEBYSHEV'S THEOREM For any set of data and for any number k, greater than one, the proportion of the data that lies within k standard deviations of the mean is at least:
CHEBYSHEV'S THEOREM for k = 2 According to Chebyshev’s Theorem, at least what fraction of the data falls within “k” (k = 2) standard deviations of the mean? At least of the data falls within 2 standard deviations of the mean.
CHEBYSHEV'S THEOREM for k = 3 According to Chebyshev’s Theorem, at least what fraction of the data falls within “k” (k = 3) standard deviations of the mean? At least of the data falls within 3 standard deviations of the mean.
CHEBYSHEV'S THEOREM for k =4 According to Chebyshev’s Theorem, at least what fraction of the data falls within “k” (k = 4) standard deviations of the mean? At least of the data falls within 4 standard deviations of the mean.
Using Chebyshev’s Theorem • A mathematics class completes an examination and it is found that the class mean is 77 and the standard deviation is 6. • According to Chebyshev's Theorem, between what two values would at least 75% of the grades be?
Mean = 77 Standard deviation = 6 At least 75% of the grades would be in the interval: 77 – 2(6) to 77 + 2(6) 77 – 12 to 77 + 12 65 to 89