Download

1 / 12
120 likes | 241 Views
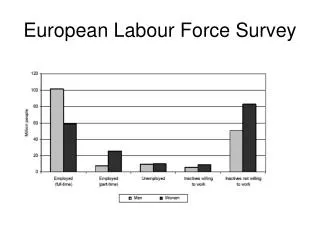
Economic Bulletin 1/09 Macroeconomic shocks – effects on employment and labour supply Haakon Solheim. Chart 1 Deviation from trend growth in labour force participation for women and men and Norges Bank’s output gap. Per cent. 1983 – 2007.

E N D
Economic Bulletin 1/09Macroeconomic shocks – effects on employment and labour supplyHaakon Solheim
Chart 1 Deviation from trend growth in labour force participation for women and men and Norges Bank’s output gap. Per cent. 1983 – 2007 Labour force measured as share of population in same age group. Trend in labour force participation is calculated using a Hodrick-Prescott filter (λ=100). Correlation: Output gap – labour force gap, women: 0.74 Output gap – labour force gap, men : 0.76 Labour force gap, women – labour force gap, men: 0.93 Sources: Statistics Norway and Norges Bank
Chart 2 GDP mainland Norway, quarterly growth, seasonally adjusted. At constant 2006-prices. 1996 Q1 –2008 Q4 . Level (in billions of NOK, left-hand axis) and change (in per cent, right-hand axis) Source: Statistics Norway
Chart 3 Accumulated effects after 1 and 8 quarters for employment and labour force for men in 11 age groups between 16 and 74 years given an increase in mainland GDP. Percentage point change for each age group. a. Employment Year
b. Labour force Year Impulse responses for each age group are estimated separately. The change in GDP is standardised to one standard deviation in the first quarter. This corresponds to seasonally adjusted growth of 0.8 per cent. The effects on employment and the labour force are measured as the percentage point change in the proportion of the population in each age group. Estimated on quarterly data from 1996 Q1 to 2008 Q8 . Changes in mainland GDP are collected from the national accounts, while employment and labour force figures are from the LFS. Numbers and standard errors are given in Tables 8 and 9.
Chart 4 Accumulated effects after 1 and 8 quarters for employment and labour force for women in 11 age groups between 16 and 74 years given an increase in mainland GDP. Percentage point change for each age group. a. Employment Year
b. Labour force Year See footnote, Chart 3.
Chart 5 Change in accumulated effect on employment and labour force from Q1 to Q8 given an increase in mainland GDP. Men and women between 16 and 74 years. Percentage point change in the share of the population in the same age group. a. Employment Year
b. Labour force Year Effects are calculated based on figures in Tables 8 and 9. Charts show the accumulated effect after Q8 minus the accumulated effect after Q1.
Chart 6 Accumulated effect on unemployment for men and women between 16 and 74 years given an increase in mainland GDP. Effects after Q1 and Q8. Percentage point change in the share of the population in the same age group.a. Men Year
b. Women Year Effects are calculated based on figures in Tables 8 and 9. Effect on unemployment is calculated as accumulated effect on the labour force minus the accumulated effect on employment.
Chart 7 Relative share of increase in employment resulting from a reduction in unemployment. Men and women between 16 and 74 years. Year Effects are calculated based on figures in Tables 8 and 9. Chart shows the accumulated effect on unemployment as a share of the accumulated effect on employment in Q8.