More on regression
160 likes | 341 Views
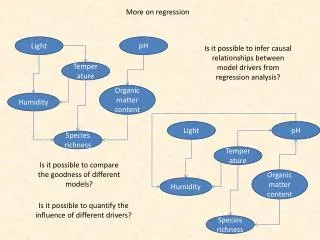
More on regression. pH. Light. Is it possible to infer causal relationships between model drivers from regression analysis?. Temperature. Organic matter content. Humidity. pH. Light. Species richness. Temperature. Is it possible to compare the goodness of different models?.

More on regression
E N D
Presentation Transcript
More on regression pH Light Is it possible to infer causal relationships between model drivers from regression analysis? Temperature Organic matter content Humidity pH Light Species richness Temperature Is it possible to compare the goodness of different models? Organic matter content Humidity Is it possible to quantify the influence of different drivers? Species richness
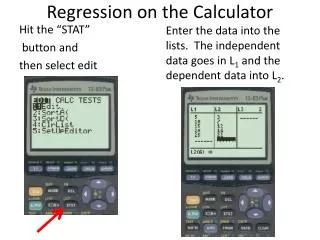
Path analysis and linear structure models (Structure equation modelling SEM) Multiple regression The error term e contains the part of the variance in Y that is not explained by the model. These errors are called residuals Regression analysis does not study the relationships between the predictor variables Path analysis defines a whole model and tries to separate correlations into direct and indirect effects Path analysis tries to do something that is logically impossible, to derive causal relationships from sets of observations.
Path analysis is largely based on the computation of partial coefficients of correlation. Path coefficients Path analysis is a model confirmatory tool. It should not be used to generate models or even to seek for models that fit the data set. We start from regressionfunctions
Using Z-transformedvalues we get eZY = 0 ZYZY = 1 Pathanalysisis a nice tool to generatehypotheses. Itfailsatlowcoefficients of correlation and circular model structures. ZXZY = rXY
Species richness and soil characteristics of ground beetles pLT pH Light pPHO Temperature pLH pTH Organic matter content Humidity pTS pHS pOS Species richness WE havesevenunknowns and needsevenlinearequations. We formulate a model of causalrelationships. We multiplyeachequation by the othervariables. T
T Correlationmatrix
T -0.63 pH Light 62.2 Temperature 0.47 0.31 Organicmattercontent Humidity -0.06 -0.22 -0.14 Speciesrichness
Logistic and other regression techniques We use odds P 1 Threshold 0.5 The logistic regression model P defines a probability according to a logistic model Surely males Surely females
Regression tree analysis tries to groups cases according to predefined nominal and ordinal variables and returns variables levels that best group these cases. It uses a heuristic pattern seeking algorithm. Root 12 29 RAR < 14.5 Australia Central Other 23 6 AMT < 11.15 Other Argentina South 17 6 AMT < 16.45 Other Argentina Pampas 11 6 RAI < 380 Other Argentina East
What is the correlation between B and X? What is the pure correlation between B and X excluding the influence of A on both X and B? rAB A B We need the partial correlation of X and B. rAX rBX X
DB DX Partial regressions are the regression of residuals excluding a third factor.
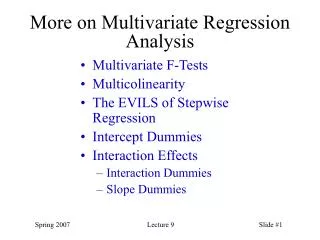
Partial linear correlations The partial linear correlations of A, B, and C on X. Multiple regression results To show the isolated influence of single predictors we show the squared partial correlation coefficients within linear regression results.