Supplementary Figure 1
10 likes | 165 Views
Supplementary Figure 1. y = 13.018 - 0.0482x R 2 = 0.99152. Supplementary Fig.1 Standard curve by survival days and contents of inoculated mBSE-BH in ddY mice.

Supplementary Figure 1
E N D
Presentation Transcript
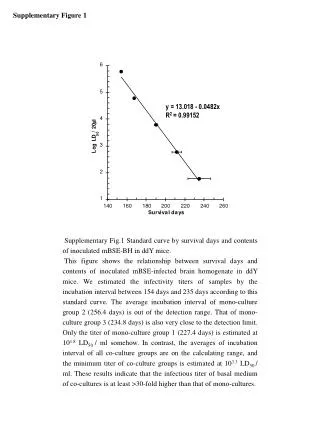
Supplementary Figure 1 y = 13.018 - 0.0482x R2 = 0.99152 Supplementary Fig.1 Standard curve by survival days and contents of inoculated mBSE-BH in ddY mice. This figure shows the relationship between survival days and contents of inoculated mBSE-infected brain homogenate in ddY mice. We estimated the infectivity titers of samples by the incubation interval between 154 days and 235 days according to this standard curve. The average incubation interval of mono-culture group 2 (256.4 days) is out of the detection range. That of mono-culture group 3 (234.8 days) is also very close to the detection limit. Only the titer of mono-culture group 1 (227.4 days) is estimated at 101.8 LD50 / ml somehow. In contrast, the averages of incubation interval of all co-culture groups are on the calculating range, and the minimum titer of co-culture groups is estimated at 103.3 LD50 / ml. These results indicate that the infectious titer of basal medium of co-cultures is at least >30-fold higher than that of mono-cultures.


