Download
1 / 40
410 likes | 531 Views
Delve into the mysterious polar caps of Mars, tracing historical observations, theories on seasonal cap behavior, and signs of climate change over millennia. Learn about key figures in Mars exploration like Christian Huygens and the discovery of the enigmatic polar regions. Explore the evolving understanding of the polar caps from water ice assumptions to CO2 compositions. Uncover the complexities of Martian climate, energy balance, and the implications for future space missions.

E N D
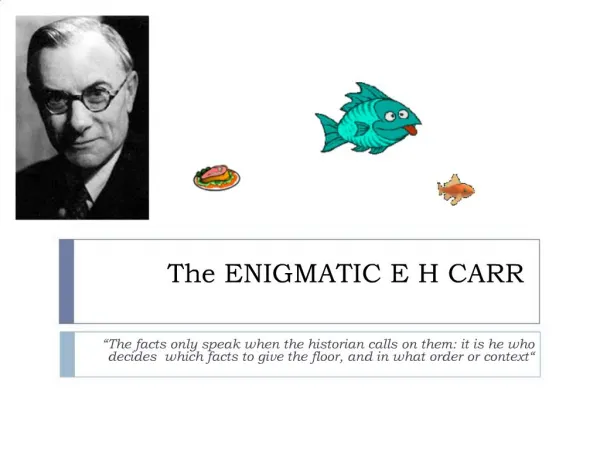
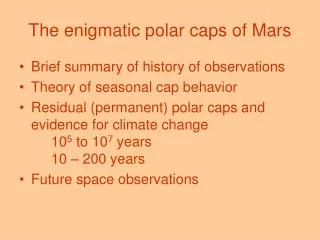
The enigmatic polar caps of Mars • Brief summary of history of observations • Theory of seasonal cap behavior • Residual (permanent) polar caps and evidence for climate change 105 to 107 years 10 – 200 years • Future space observations
Sir William Herschel • Discovered Uranus • Discovered IR radiation • Deduced disc galaxy • Recognized that polar caps were seasonal; used observations to measure Mars’ obliquity (1784)
G. Johnstone Stoney • Suggested term “electron” for unit of charge in 1891 • Applied kinetic theory of gasses to planetary atmospheres. Studied helium in earth’s atmosphere. • Used this to suggest that Martian polar caps are CO2.
Composition of Seasonal Cap • Scientists (except Stoney) assumed that the caps were water ice snow • This assumption was crucial to Percival Lowell’s canal theory, since he assumed the melting polar caps were the source of water. • Kuiper used reflection spectra to identify water ice in cap. He also measured CO2 in atmosphere.
Mariner 4 (1965) • Radio occultations Martian atmospheric pressure is ~ 600 pascals, over an order of magnitude less than most conservative previous estimates. Therefore, pATM ~ pCO2.
Polar energy balance • Absorbed insolation + net energy advected into region + conduction from subsurface + IR radiance from atmosphere + latent heat released by subliming CO2 = energy radiated by surface • L & M (Science, ’66) showed that CO2 will condense and that seasonal polar caps are carbon dioxide
1980’s-1990’s • Hiatus in space exploration of Mars • Modeling of polar caps using the Viking pressure curves as the primary constraint • One D models gave way to GCM models based on primitive atmospheric equations • Curves can be fit to pressure and predicts mass of CO2 condensed
CO2 Condensed Mass • During polar night the latent heat should be roughly equal to the radiation • Unphysically low emissivities required to avoid having too much CO2 condense leading to large amplitude pressure curve • Is there an additional source of energy (in addition to CO2 latent heat) in polar night?
Conduction from sub-surface • The ability of the surface to store energy is determined by thermal inertia = √KTρcP • Thermal inertia of surface traditionally determined from diurnal temperature observations that sample ~ 1-10 cm. For that inertia, conduction is unimportant • However, the seasonal penetration is much greater and samples ~ 10 cm – 1 m
Thermal storage in surface • GRS discovered that in the polar regions there is nearly pure water ice just beneath the surface • This enhances the conduction storage term and reduces CO2 condensation to match pressure
Buffering • Suppose that CO2 remains at one of the poles all year. • In equilibrium, the energy absorbed by the cap = Energy radiated by cap = σT(p)4 • Energy absorbed ~ sinα (obliquity) • In pure CO2, sublimation temperature is a function of pressure • So if there is big enough block of CO2 at poles, p will change with obliquity
Obliquity • The obliquity of Mars changes greatly over relatively short time scales due to the effects of other planets. • Pressure change would bring about different climate (Sagan & Malin, ’73)
One of main goals of polar orbiting Viking Orbiter 2 was to determine composition of the much larger residual north polar cap. VO2 measured water vapor concentration (MAWD) and surface temperature (IRTM) of 220 K during summer. Result: residual north polar cap water ice IRTM later showed that smaller residual south cap is CO2 ice because its temper-ature remains at ~ 150 K all summer.
Polar Layered Terrain • Viking discovered that ground underlying the caps is composed of many layers • Possibly responds to variation of orbital parameters with T ~ 105 – 107 years • Layers composed of various mixtures of dust and water ice
Mars Orbiter Camera on MGS • Two wide angle (140˚ FOV) cameras make daily global map in red and blue wavelengths • High resolution camera can resolve features as small as ½ meter at nadir; minus blue filter
Residual South Cap: MOC Color images of the residual south polar cap at LS=306º on (A) February 22, 2000, (B) January 9, 2002, and (C) November 28, 2003.
Flux redistribution by dust • Visible flux at surface CO2 frost decreases with increasing dust optical depth • However, infrared flux increases with increasing optical depth because of emission by hot dust
Effect of dust on sublimation • Region with 0% dust sublimes more rapidly with increasing optical depth • Region with large dust content and low visible albedo sublimes more slowly • Effect on sublimation small for typical areas in the seasonal cap
RSPC Albedo • Measurements from HST HRC at 2003 opposition • Dashed lines are albedos assuming τ = 0; solid lines τ = 0.2 • Albedos sufficient to stabilize residual cap • Dust will increase sublimation rate
Conclusions • The RSPC is a unique feature totally unlike other portions of the polar caps • The RSPC is dynamic on time scales of years. Stratigraphy suggests short deposition periods separated by longer periods of erosion • The timeline, together with Mariner 9 B images, suggest that the last period of deposition was somewhere around 1970 • Late season dust storms could effect removal of RSPC units • May also be connected with H2O ice distribution
Mars Reconnaissance Orbiter • HIRISE: hi res with some color • MARCI 180˚ FOV 5 vis + 2 uv bands • CTX: 5 meters / pixel • CRISM: imaging spectrometer .4 - 4μm • MCS: atm profiles • SHARAD: 15 meter depth resolution
Polar Observations • 3pm orbit (compare 2 pm for MGS 5 pm Odyssey) • Periapsis over south pole at 255 KM • Apoapsis over north pole at 320 Km • After one (earth year) < 5 km between ground tracks at equator • 12 orbits cross the poles every day
MARCI Polar Science • Acquire albedo maps of the poles in five bands and two UV channels • Study behavior of dust storms and condensate clouds associated with the frost boundaries of both poles • Search for interannual variability of and within seasonal caps • Diurnal behaviors of storms and clouds • Study frost phase functions at various wavelengths
Polar Observations • CTX is ideal for monitoring temporal changes in “Swiss cheese” features in RSPC, spiders, dark spots, etc. in the South Polar Region • Similarly, CTX should be useful for monitoring albedo features and specific areas in the north polar region. • CTX should reveal details of polar dust storm and cloud structures